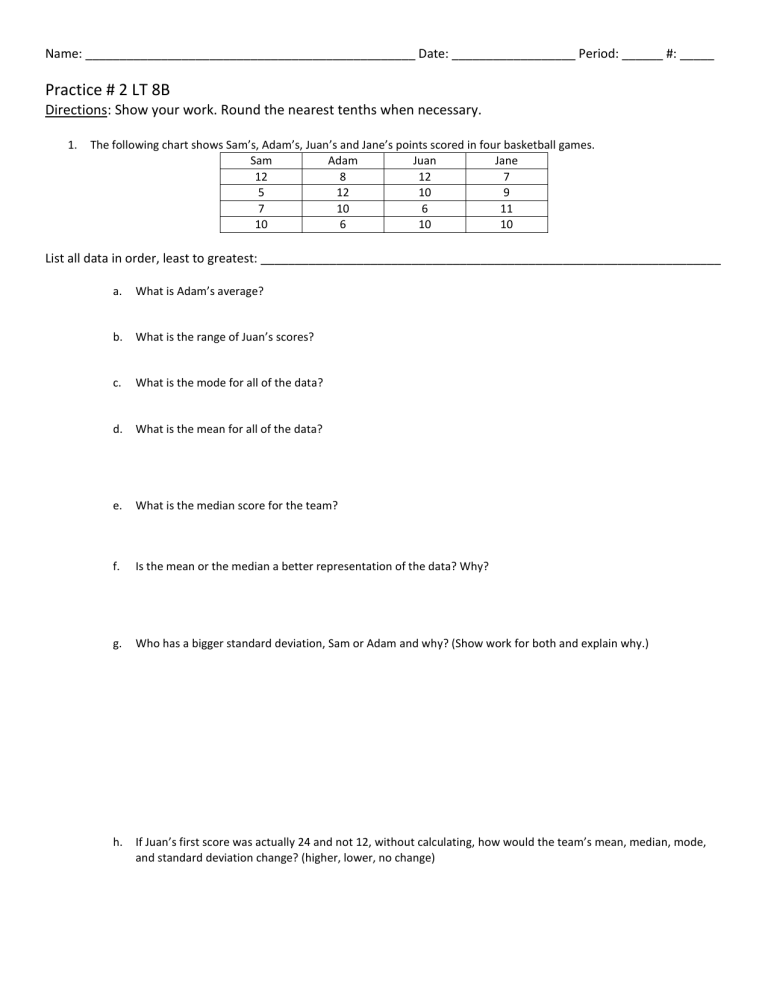
Name: ________________________________________________ Date: __________________ Period: ______ #: _____ Practice # 2 LT 8B Directions: Show your work. Round the nearest tenths when necessary. 1. The following chart shows Sam’s, Adam’s, Juan’s and Jane’s points scored in four basketball games. Sam Adam Juan Jane 12 8 12 7 5 12 10 9 7 10 6 11 10 6 10 10 List all data in order, least to greatest: ___________________________________________________________________ a. What is Adam’s average? b. What is the range of Juan’s scores? c. What is the mode for all of the data? d. What is the mean for all of the data? e. What is the median score for the team? f. Is the mean or the median a better representation of the data? Why? g. Who has a bigger standard deviation, Sam or Adam and why? (Show work for both and explain why.) h. If Juan’s first score was actually 24 and not 12, without calculating, how would the team’s mean, median, mode, and standard deviation change? (higher, lower, no change)


