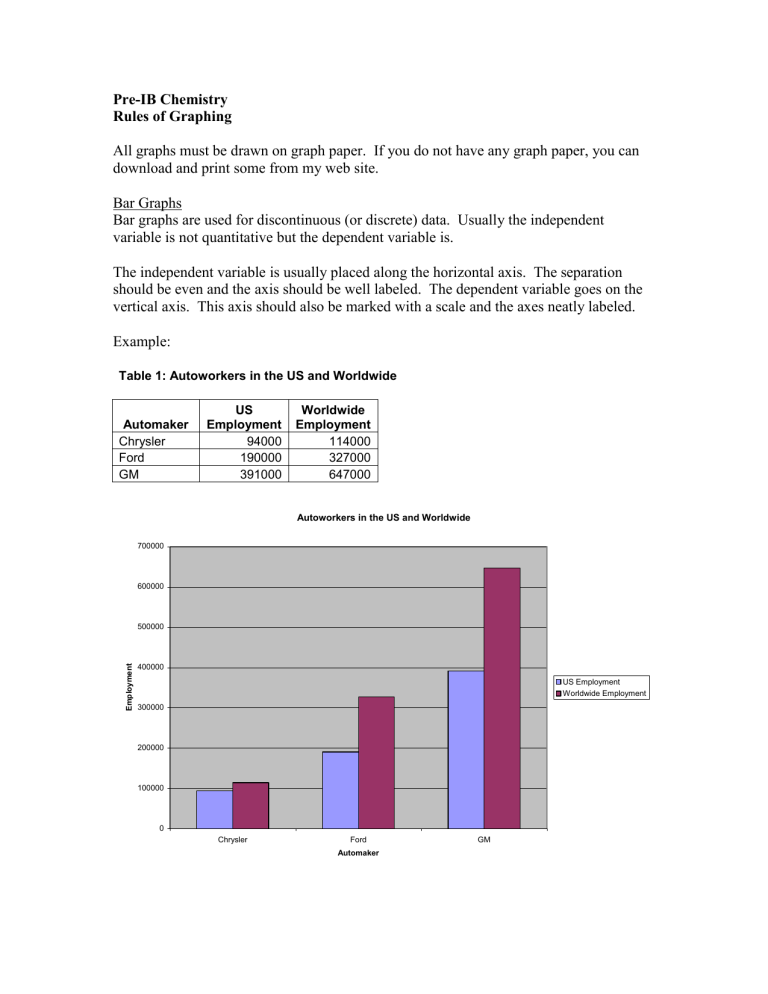
Pre-IB Chemistry Rules of Graphing All graphs must be drawn on graph paper. If you do not have any graph paper, you can download and print some from my web site. Bar Graphs Bar graphs are used for discontinuous (or discrete) data. Usually the independent variable is not quantitative but the dependent variable is. The independent variable is usually placed along the horizontal axis. The separation should be even and the axis should be well labeled. The dependent variable goes on the vertical axis. This axis should also be marked with a scale and the axes neatly labeled. Example: Table 1: Autoworkers in the US and Worldwide Automaker Chrysler Ford GM US Employment 94000 190000 391000 Worldwide Employment 114000 327000 647000 Autoworkers in the US and Worldwide 700000 600000 Employment 500000 400000 US Employment Worldwide Employment 300000 200000 100000 0 Chrysler Ford Automaker GM Scatter Plots A scatter plot is used when both the independent and dependent variables are continuous and numerical. 1. Construct and label your axes with both the variable names and the units. The independent variable goes on the horizontal or “x” axis, the dependent variable goes on the vertical or “y” axis. 2. Make the graph large enough. You should number the axes in such a way that your graph takes up at least half a page. Remember that a graph is a picture of your data. If you were asked to draw a picture in art class, you would not just use one small corner of your paper! 3. Choose the origin. This does not have to be (0,0); it depends on your data. If you know that (0,0) should be a data point or if 0 should have come first in your data, then it should be the origin of your graph. If your graph does not start at (0,0), you should mark a break on the axis. You may not break the axis within the range of your data. 4. Choose a scale. Look at the range of your data before you begin to determine how to fit your data to the graph. Be sure that the spacing of the numbers if uniform and appropriate. Also readable. There should be as much space between 2 and 3 as between 6 and 7. Having a box represent 7 units is difficult to plot and read. Also, if your axes take up half the page, but all your data fits in a little corner of the graph, you have missed the point. Each axis may have a different scale. 5. Plot your points. If you know (0,0) should be a point, plot it. 6. Put in a best fit line or curve. Your points will almost never fall precisely on a line or curve because of experimental error. NEVER JOIN THE DOTS WITH A ZIG ZAG LINE! Take a straight edge and see if your points all fall close to a line. If they do, draw it in with the straight edge getting as close to as many points as possible. They may instead indicate a curve, in which case, draw a smooth curve getting as close to as many points as possible. Perhaps the graph will plateau. There may also be no relationship. You must decide what is appropriate. 7. Title your graph. Indicate simply what is being graphed in the title. Example: Temperature of Water Over Time Temperature (degrees C) 0 0 0 0 2 10 15 22 27 Time (minutes) 0 2 4 6 8 10 12 14 16 Temperature of Water Over Time 30 Temperature (degrees C) 25 20 15 10 5 0 0 2 4 6 8 10 Time (min) 12 14 16 18 Now it’s time to practice: Graph the following data appropriately. 1. Effect of Pressure on the Volume of a Balloon Pressure (torr) 100 150 200 250 300 350 400 Volume (L) 10.0 6.7 5.0 4.0 3.3 2.9 2.5 2. Effect of Fertilizer on Seed Mass Fertilizer per gallon of water (g) 0.05 1.75 2.00 3.00 4.00 Average Seed mass per 1000 seeds (g) 1.00 1.75 2.35 3.18 4.07 3. Heron Sightings in Different Seasons Season Spring Summer Fall Winter Number of Herons 30 39 18 4 4. Mass of Water Absorbed (in grams) by Different Brands of Paper Towels Time (seconds) 10 15 20 A .5 1.5 2.3 Brand of Towel B 1.2 1.7 2.5 C 1.2 2.3 2.5


