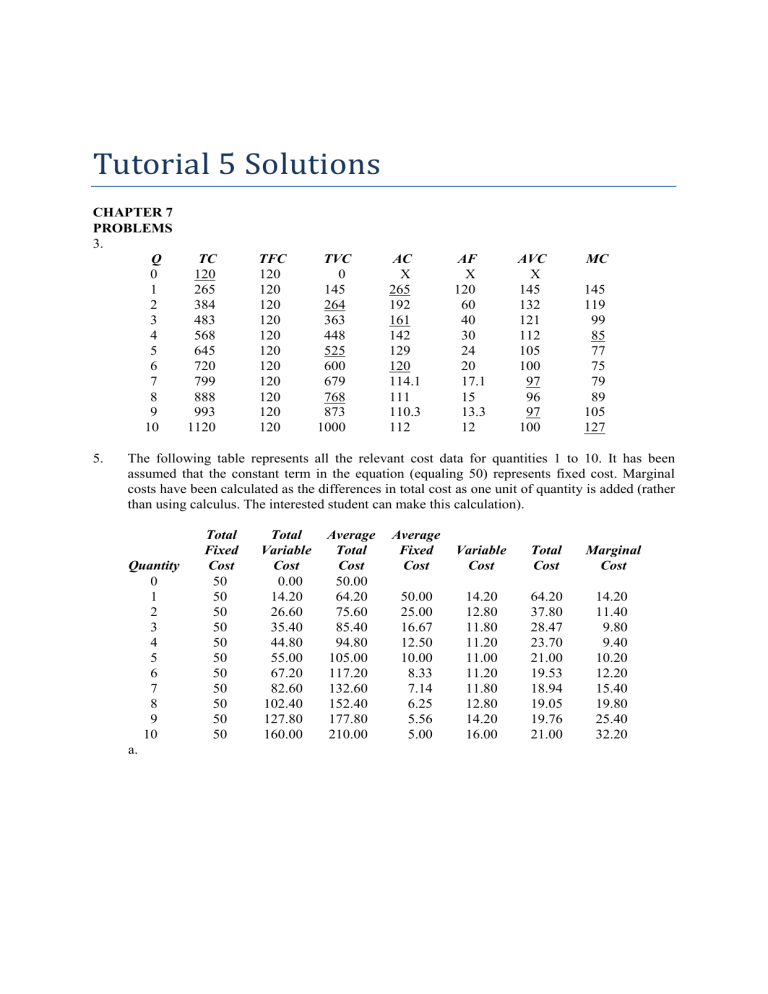
Tutorial 5 Solutions CHAPTER 7 PROBLEMS 3. Q 0 1 2 3 4 5 6 7 8 9 10 5. TC 120 265 384 483 568 645 720 799 888 993 1120 TFC 120 120 120 120 120 120 120 120 120 120 120 TVC 0 145 264 363 448 525 600 679 768 873 1000 AC X 265 192 161 142 129 120 114.1 111 110.3 112 AF X 120 60 40 30 24 20 17.1 15 13.3 12 AVC X 145 132 121 112 105 100 97 96 97 100 MC 145 119 99 85 77 75 79 89 105 127 The following table represents all the relevant cost data for quantities 1 to 10. It has been assumed that the constant term in the equation (equaling 50) represents fixed cost. Marginal costs have been calculated as the differences in total cost as one unit of quantity is added (rather than using calculus. The interested student can make this calculation). Quantity 0 1 2 3 4 5 6 7 8 9 10 a. Total Fixed Cost 50 50 50 50 50 50 50 50 50 50 50 Total Variable Cost 0.00 14.20 26.60 35.40 44.80 55.00 67.20 82.60 102.40 127.80 160.00 Average Total Cost 50.00 64.20 75.60 85.40 94.80 105.00 117.20 132.60 152.40 177.80 210.00 Average Fixed Cost Variable Cost Total Cost Marginal Cost 50.00 25.00 16.67 12.50 10.00 8.33 7.14 6.25 5.56 5.00 14.20 12.80 11.80 11.20 11.00 11.20 11.80 12.80 14.20 16.00 64.20 37.80 28.47 23.70 21.00 19.53 18.94 19.05 19.76 21.00 14.20 11.40 9.80 9.40 10.20 12.20 15.40 19.80 25.40 32.20 TC ($) 250 200 150 Total Cost 100 50 0 0 1 2 3 4 5 6 7 8 9 10 Q Figure 7.6 b. All data are shown in the table above. 40 $ 35 30 25 Average Cost 20 Marginal Cost Average Var Cost 15 10 5 0 0 1 2 3 4 5 6 7 8 9 10 Q Figure 7.7 c. Grand Corporation has a cubic cost function. This means that it passes through all three cost areas. Looking at the marginal cost curve, decreasing marginal costs prevail until 4 units are produced, after which increasing marginal costs are present. As the marginal cost passes from decreasing to increasing, it arrives at a minimum point at which it is constant. 7. Instructors should have an interesting time discussing this question. We recommend that this question be answered in class by small groups of students (perhaps 4 to 6). Each group should be allowed a short time to discuss the problem and to reach a consensus about the cost estimate. We have found that it is extremely rare for two groups to arrive at the same estimate. We have also found that groups may not be able to agree upon a single estimate. There is no unique answer to this question because it all depends on the assumptions that one makes about the cost conditions. However, based on the strict criteria of relevant cost (i.e. incremental or variable cost), we suggest that the following estimate: Boat fuel Travel expenses (gas, oil, and tires only) Bait, etc. Food Beverages $45 18 50 40 35 $188 or $9.40 per fish Of course, it can also be argued that a certain amount of the food and beverage costs should not be included because he would incur these costs regardless of whether he goes fishing. Also, at the risk of stirring up a heated debate, instructors may also wish to consider the opportunity cost of Sarah’s time in cleaning the fish (and in fact why she has to clean the fish in the first place!)


