fe at u r e
Neurons in focus
Two-Photon Excitation Imaging in Live Neuronal Tissue.
Nowhere is preserving native cellular context more important than in studies of the nervous system. This intricate 3D structure is at the core of all
of the complex functions we observe—disrupt it, and function is altered. Despite the easy access provided by dissociated neurons in culture, especially
in optically based investigations such as fluorescence-based calcium imaging [1], the need for more contextual and system-level analysis has driven
the development of techniques capable of exploring tissue slices and even the whole brain. Two-photon excitation (TPE) of fluorescent sensors is
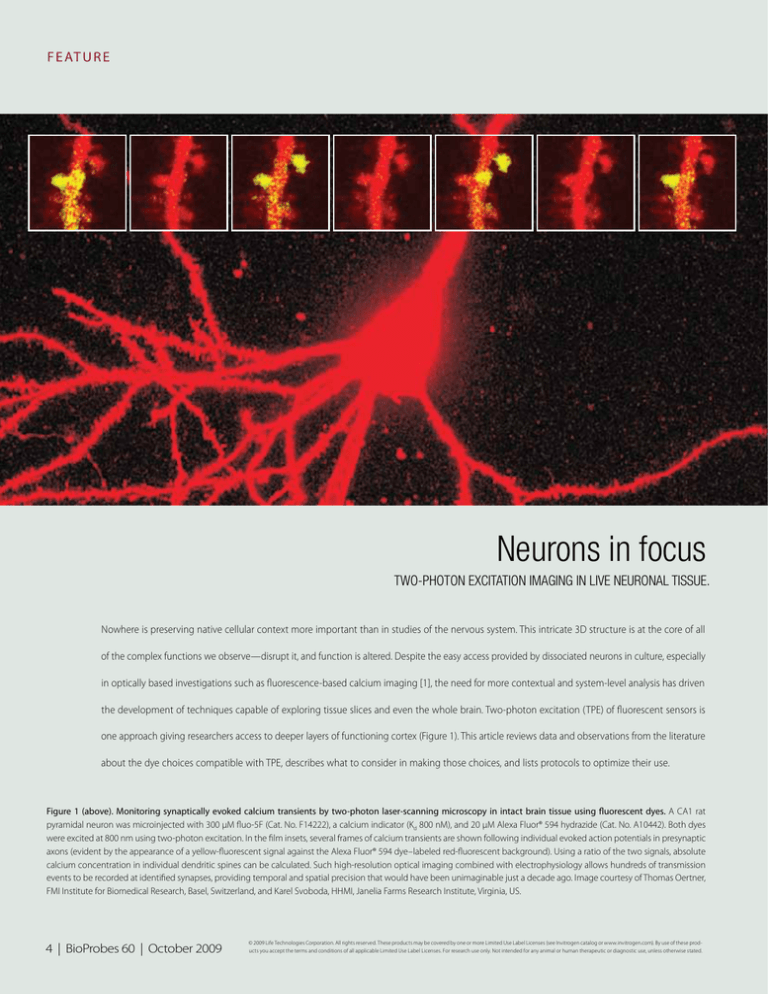
one approach giving researchers access to deeper layers of functioning cortex (Figure 1). This article reviews data and observations from the literature
about the dye choices compatible with TPE, describes what to consider in making those choices, and lists protocols to optimize their use.
Figure 1 (above). Monitoring synaptically evoked calcium transients by two-photon laser-scanning microscopy in intact brain tissue using fluorescent dyes. A CA1 rat
pyramidal neuron was microinjected with 300 µM fluo-5F (Cat. No. F14222), a calcium indicator (Kd 800 nM), and 20 µM Alexa Fluor® 594 hydrazide (Cat. No. A10442). Both dyes
were excited at 800 nm using two-photon excitation. In the film insets, several frames of calcium transients are shown following individual evoked action potentials in presynaptic
axons (evident by the appearance of a yellow-fluorescent signal against the Alexa Fluor® 594 dye–labeled red-fluorescent background). Using a ratio of the two signals, absolute
calcium concentration in individual dendritic spines can be calculated. Such high-resolution optical imaging combined with electrophysiology allows hundreds of transmission
events to be recorded at identified synapses, providing temporal and spatial precision that would have been unimaginable just a decade ago. Image courtesy of Thomas Oertner,
FMI Institute for Biomedical Research, Basel, Switzerland, and Karel Svoboda, HHMI, Janelia Farms Research Institute, Virginia, US.
4 | BioProbes 60 | October 2009
© 2009 Life Technologies Corporation. All rights reserved. These products may be covered by one or more Limited Use Label Licenses (see Invitrogen catalog or www.invitrogen.com). By use of these products you accept the terms and conditions of all applicable Limited Use Label Licenses. For research use only. Not intended for any animal or human therapeutic or diagnostic use, unless otherwise stated.
Advantages of TPE for live-tissue analysis
The practical application of TPE microscopy has advanced considerably
through the pioneering work of Watt Webb and his colleagues during
TPE excitation through
water immersion objective
Dye ejection
pipette
Tissue culture
dish with opening
the last two decades [2,3]. The principle of TPE was first predicted by
Maria Göppert-Mayer in 1931 [4], and it is after her that the TPE unit
of absorption cross-section or excitation efficiency is named. It took
another three decades and the invention of the pulsed ruby laser, followed by the invention of TPE laser scanning microscopy in 1990 [2], to
see TPE emerge as a practical application. The principal advantages are
increased depth of resolution (due to the use of near infrared light—700
to 1,100 nm), narrow focal plane of the excitation volume (less than
100 μm), and reduced photobleaching of dye above and below the
imaged region (~0.1 μm3) [5]. Thus high-resolution, 3D images of depths
Visible cortex depth
Illuminated
Epi-fluorescence
microscope
0–20 µm
Confocal
microscope
0–200 µm
Stained
Neurons
TPE excitation
microscope
0–>1 mm
Astrocytes
labeled
with SR101
Figure 2. Schematic diagram showing a two-photon excitation (TPE)
imaging setup and the depths of resolution of commonly used imaging techniques.
up to 1 mm (up to 2 mm in some tissues) can be achieved, compared
to less than 200 μm for visible light–based approaches [6] (Figure 2).
The science behind TPE is well reviewed elsewhere [7], but can be
conceptualized as a summing of the excitation energies through two
Choosing a fluorophore
long-wave photons (e.g., 1,000 nm) that are focused and concentrated at
In general, any bright one-photon dye can be used in TPE imaging if
discrete, small focal volumes (Figure 3). Concentrated in time and space,
a somewhat blue-shifted excitation maximum is used (for a complete
the two weak photons can sum their energies and excite fluorophores
survey, see the excellent reviews in references 7 and 8). Table 1 lists
that normally have excitation maxima half that value. Since the excita-
specific dyes that have been shown to be useful in TPE experiments.
tion beam is concentrated in one focal plane, often as small as 0.1 µm3,
Qdot® nanocrystals have remarkable TPE cross-sectional areas
there is reduced photobleaching above and below the plane of interest,
estimated to be three orders of magnitude greater than the best
which eliminates phototoxicity. Thus TPE is rapidly becoming a preferred
fluorescent dyes or fluorescent proteins. Depending on the size of
excitation source for physiological analysis of live tissue.
the Qdot® nanocrystal used, various fluorescent colors can be
Figure 3. An experiment illustrating ordinary (single-photon) excitation of fluorescence and two-photon
excitation. The cuvette contains a solution of the dye safranin O, which normally emits yellow light when
excited by green light. The upper lens focuses green (543 nm) light from a CW helium–neon laser into the
cuvette, producing the expected conical pattern of excitation (fading to the left). The lower lens focuses
pulsed infrared (1,046 nm) light from a neodymium–YLF laser. In two-photon absorption, the excitation is
proportional to the square of the intensity; thus, the emission is confined to a small point focus (see arrow),
which can be positioned anywhere in the cuvette by moving the illuminating beam. Image contributed
by Brad Amos, Science Photo Library, London.
© 2009 Life Technologies Corporation. All rights reserved. These products may be covered by one or more Limited Use Label Licenses (see Invitrogen catalog or www.invitrogen.com). By use of these products you accept the terms and conditions of all applicable Limited Use Label Licenses. For research use only. Not intended for any animal or human therapeutic or diagnostic use, unless otherwise stated.
www.invitrogen.com | 5
F E at u r e
generated from a single wavelength of excitation, allowing multiplexing
considered, and, when used with Pluronic® F-127 (Invitrogen Cat. No.
experiments to be performed relatively easily and without concern for
P6867) (BASF Corporation), their uptake is increased. It is necessary to
phototoxicity or photobleaching. The many variations of fluorescent
consider various outcomes when optimizing the experimental setup:
proteins, which also possess excellent cross-sectional absorption areas,
for example, signal gain vs. signal-to-noise ratio, speed of response, the
are also readily adaptable to TPE.
binding affinity of the dye, and color choice. These attributes are summarized in Tables 1 and 2, and a range of options exists. For example,
Oregon Green® 488 BAPTA, when equimolar to fluo-4, is three times
Multi-cell bolus labeling (MCBL)
brighter, so three times less excitation could be used to achieve the
The simplest way to label cells is to use a micropipet to place dye in
same response. Reduced light excitation is a key factor in maintaining
the region of interest in a technique called multi-cell bolus labeling
cell health. Oregon Green® 488 BAPTA also produces faint staining at
(MCBL, Figure 2). Easier than achieving either whole-cell patch clamp
low calcium or pre-stimulation levels, which can be helpful in finding
or intracellular contact, MCBL can be used to deliver calcium-sensing
the cells. But fluo-4 and its variants are used when a much bigger signal
dyes and dyes that selectively label astrocytes (sulforhodamine 101
change is needed. For example, 100 μM of fluo-4 or fluo-5F can provide
(SR101) or its fixable version, Texas Red® hydrazide) in one 5-second
as much as a 50% signal increase in pyramidal cells [7]. For on/off sensing
injection pulse [9,10]. Many cells stained in this way are observed to
at individual neurons, Oregon Green® 488 BAPTA is a good choice, but
for submicron regions like dendritic spines, the greater signal change
have taken up the dye within 20 minutes [11].
This approach offers two main benefits: (1) individual cells (micro)
with fluo-4 is preferred.
as well as groups of cells (macro) can be studied in the same field; and
(2) signal can be precisely attributed to astrocytes or neurons. This
approach is effective in lower vertebrates and mammals, including
Intracellular injection
whole alert mice and rats, at dye concentrations as low as 100 μM [8].
While more difficult to perform, whole-cell patch clamping and delivery
For this application, the dyes chosen must be cell permeant. Oregon
of dyes into cells via microelectrodes allow more precise calcium ion
Green® 488 BAPTA-1 AM has been used, but fluo-4 and others can be
concentration determinations, control of electrical behavior of the
Table 1. Excitable fluorophores for calcium detection for use in two-photon excitation (TPE) microscopy.
Red indicators
Blue and green indicators
Fluorophore
Kd in solution at 22–24°C*
Φ TPE cross-section†
TPE optimal excitation
Emission
Oregon Green® 488 BAPTA-1 and -2
170 nM
ND
810–880 nm
530 nm
Fluo-3
325 nM
10 GM/5 GM
810 nm
526 nm
Fluo-4
345 nM
ND
800 nm
516 nm
Fluo-5F
2.3 µM
ND
810 nm
520–530 nm
Fluo-4FF
9.7 µM
ND
810 nm
516 nm
Calcium Green™-1 +/– Ca
190 nM
30 GM/2 GM
820 nm
530 nm
Fura-2 +/– Ca
140 nM
6 GM/0.2 GM
800 nm
505/362 nm
Indo-1 +/– Ca
230 nM
3.5 GM/1.5 GM
590/700 nm
490/400 nm
X-rhod-1
0.7 µM
ND
900 nm
602 nm
X-rhod-5F
1.6 µM
ND
770–800 nm
603 nm
X-rhod-FF
17 µM
ND
ND
Rhod-FF
19 µM
ND
ND
603 nm
603 nm
–50
* Kd can change inside cells (see reference 11). Data shown are according to Molecular Probes data taken at 22°C. † Expressed in Göppert-Mayer Units (GM); 1 GM = 10
For a more complete listing of TPE experiment–compatible dyes, see www.invitrogen.com/bp60. ND = Not determined.
6 | BioProbes 60 | October 2009
cm4 s.
© 2009 Life Technologies Corporation. All rights reserved. These products may be covered by one or more Limited Use Label Licenses (see Invitrogen catalog or www.invitrogen.com). By use of these products you accept the terms and conditions of all applicable Limited Use Label Licenses. For research use only. Not intended for any animal or human therapeutic or diagnostic use, unless otherwise stated.
Table 2. Other useful stains for use in two-photon excitation (TPE) microscopy.
Stain
Target
CoroNa™ Green
NA
ND
770 nm
516 nm
CoroNa™ Red
NA
ND
~1,000 nm
570 nm
Sulforhodamine 101 (SR101) or Texas Red® hydrazide
(fixable version of SR101)
Astrocytes
ND
840–890 nm
605 nm
ND
810 nm
594 nm
800–1,030 nm
505–610 nm
600 nm
+
Φ TPE cross-section*
Alexa Fluor® 594 hydrazide
Ca2 -insensitive
intracellular marker
Fluorescent proteins
General expression tag
100–200 GM
TPE optimal excitation
Emission
Rhodamine B
General cell stain
100–200 GM
840 nm
Lucifer yellow CH L453, L682, L1177
Gap junctions
ND
850 nm
533 nm
DAPI
DNA/nuclei
0.16 GM
700 nm
450 nm
FM® 1-43
Vesicle recycling
ND
840 nm
575–600 nm†
Qdot® nanocrystals
NA
Up to 47,000 GM
Broad
8 colors from 545–800 nm
* Expressed in Göppert-Mayer Units (GM); 1 GM = 10–50 cm4 s. † Strongly environment dependent. NA = Not applicable. ND = Not determined.
For a more complete listing of TPE experiment–compatible dyes, see www.invitrogen.com/bp60.
cell, and delivery of intracellular agonists to second messengers. High
affinity dyes such as fluo-4, fluo-5F, X-rhod-1, or X-rhod-5F are used
The future of TPE imaging
to detect single action potentials or small synaptically evoked signals
Using the TPE technique, experiments considered impossible several
whereas lower affinity dyes such as fluo-4FF, X-rhod-FF, or rhod-FF are
years ago are now moving ahead. Possibly the most remarkable and
used to sense trains of action potentials or larger synaptically evoked
complex of these approaches involves analysis of the contribution of
signals [12]. It has been noted that the apparent affinities of nearly all
NMDA-induced calcium transients to secondary downstream signaling
dyes will be affected by other ions already free in the sample; thus the
such as RAS [14] at the level of individual dendritic spines of hippocam-
affinities offered in the table generally need to be halved to estimate
pal neurons in brain slices. NMDA pulses are delivered with regional
their behavior in cells. Moreover, the interaction of calcium with the
accuracy by using the same TPE to uncage MNI-caged glutamate [15].
dye will also impact the free calcium levels, competing for ions that
Alternatively, fluorescent protein–tagged protein pairs can be co-
might otherwise be signaling.
injected and FRET interactions studied through lifetime changes, as
While ratiometric dyes (e.g., the excitation ratio fura dyes or
regulatory elements combine in response to ion fluxes [13]. Tools like
the emission ratio indo-1 dyes) are optimal for deriving accurate
these, available from Invitrogen (Tables 1 and 2), are allowing research-
calcium concentrations, TPE does not readily lend itself to this
ers to explore the molecular substrates of learning and memory at the
approach. A far easier approach is to co-inject a red dye, such as
most basic structural level—the minute spines that decorate dendrites
Alexa Fluor® 594 dye, and monitor ratio changes in levels of indica-
throughout the brain. Learn more at www.invitrogen.com/bp60. ■
tor dye against the constant value of the Alexa Fluor® 594 dye for
that cell [7]. One group has shown that multiple sensing dyes can
be co-injected, which opens a diverse range of indicator options. In
their experiments, they filled neurons via intracellular injection with
a sodium-sensing reagent, CoroNa™ dye, and a red-shifted calcium
indicator, X-rhod-5F. Both can be excited by 770 nm light, conveniently far from the wavelengths used to excite Green Fluorescent
Protein (GFP)-labeled neurons (commonly employed to observe
cell morphology and to identify candidate cells), yet their emissions
are monitored separately. In doing so, they found that currents for
sodium and calcium were co-distributed at action potential initiation
sites in cochlear interneurons [13].
References
1. Tsien RY (1981) Nature 290:527–528.
2. Denk W et al. (1990) Science 248:73–76.
3. Xu C et al. (1996) Proc Natl Acad Sci U S A 93:10763–10768.
4. Göppert-Mayer M (1931) Ann Phys 9:273–295.
5. Zipfel WR et al. (2003) Nat Biotechnol 21:1369–1377.
6. O’Malley D (2008) Methods Cell Bio 89:95–128.
7. Svoboda K, Yasuda R (2006) Neuron 50:823–839.
8. Garaschuk O et al. (2006) Pflugers Arch: Eur J Physiol 453:385–396.
9. Stosiek C et al. (2003) Proc Natl Acad Sci U S A 100:7319–7324.
10.Nimmerjahn A et al. (2004) Nat Methods 1:31–37.
11.Kuchibhotla KV et al. (2009) Science 323:1211–1215.
12.Yasuda R et al. (2004) Sci STKE (219):1–20.
13.Bender KJ, Trussel LO (2009) Neuron 61:259–271.
14.Yasuda R et al. (2006) Nat Neurosci 9:283–291.
15.Sobczyk A, Svoboda K (2007) Neuron 53:17–24.
© 2009 Life Technologies Corporation. All rights reserved. These products may be covered by one or more Limited Use Label Licenses (see Invitrogen catalog or www.invitrogen.com). By use of these products you accept the terms and conditions of all applicable Limited Use Label Licenses. For research use only. Not intended for any animal or human therapeutic or diagnostic use, unless otherwise stated.
www.invitrogen.com | 7


