Borehole Stress-Monitoring Sites (SMSs) for monitoring stress
advertisement
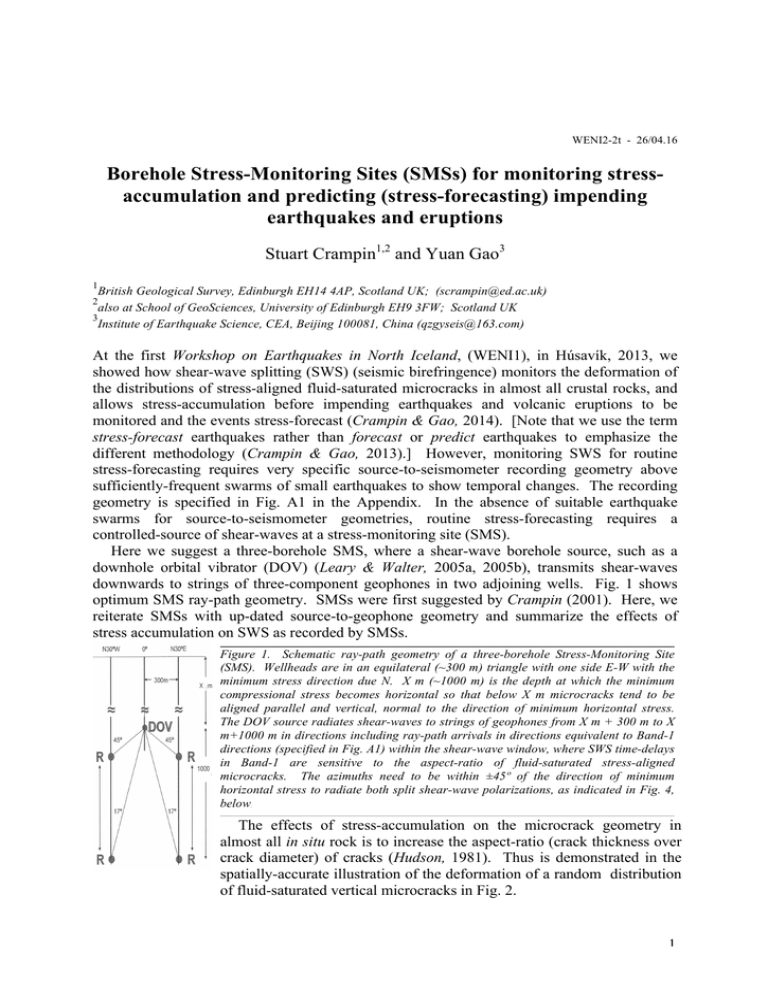
WENI2-2t - 26/04.16 Borehole Stress-Monitoring Sites (SMSs) for monitoring stressaccumulation and predicting (stress-forecasting) impending earthquakes and eruptions Stuart Crampin1,2 and Yuan Gao3 1 British Geological Survey, Edinburgh EH14 4AP, Scotland UK; (scrampin@ed.ac.uk) also at School of GeoSciences, University of Edinburgh EH9 3FW; Scotland UK 3 Institute of Earthquake Science, CEA, Beijing 100081, China (qzgyseis@163.com) 2 At the first Workshop on Earthquakes in North Iceland, (WENI1), in Húsavík, 2013, we showed how shear-wave splitting (SWS) (seismic birefringence) monitors the deformation of the distributions of stress-aligned fluid-saturated microcracks in almost all crustal rocks, and allows stress-accumulation before impending earthquakes and volcanic eruptions to be monitored and the events stress-forecast (Crampin & Gao, 2014). [Note that we use the term stress-forecast earthquakes rather than forecast or predict earthquakes to emphasize the different methodology (Crampin & Gao, 2013).] However, monitoring SWS for routine stress-forecasting requires very specific source-to-seismometer recording geometry above sufficiently-frequent swarms of small earthquakes to show temporal changes. The recording geometry is specified in Fig. A1 in the Appendix. In the absence of suitable earthquake swarms for source-to-seismometer geometries, routine stress-forecasting requires a controlled-source of shear-waves at a stress-monitoring site (SMS). Here we suggest a three-borehole SMS, where a shear-wave borehole source, such as a downhole orbital vibrator (DOV) (Leary & Walter, 2005a, 2005b), transmits shear-waves downwards to strings of three-component geophones in two adjoining wells. Fig. 1 shows optimum SMS ray-path geometry. SMSs were first suggested by Crampin (2001). Here, we reiterate SMSs with up-dated source-to-geophone geometry and summarize the effects of stress accumulation on SWS as recorded by SMSs. _____________________________________________________________________________________________________________________________________________ Figure 1. Schematic ray-path geometry of a three-borehole Stress-Monitoring Site (SMS). Wellheads are in an equilateral (~300 m) triangle with one side E-W with the minimum stress direction due N. X m (~1000 m) is the depth at which the minimum compressional stress becomes horizontal so that below X m microcracks tend to be aligned parallel and vertical, normal to the direction of minimum horizontal stress. The DOV source radiates shear-waves to strings of geophones from X m + 300 m to X m+1000 m in directions including ray-path arrivals in directions equivalent to Band-1 directions (specified in Fig. A1) within the shear-wave window, where SWS time-delays in Band-1 are sensitive to the aspect-ratio of fluid-saturated stress-aligned microcracks. The azimuths need to be within ±45º of the direction of minimum horizontal stress to radiate both split shear-wave polarizations, as indicated in Fig. 4, below. _____________________________________________________________________________________________________________________________________________ The effects of stress-accumulation on the microcrack geometry in almost all in situ rock is to increase the aspect-ratio (crack thickness over crack diameter) of cracks (Hudson, 1981). Thus is demonstrated in the spatially-accurate illustration of the deformation of a random distribution of fluid-saturated vertical microcracks in Fig. 2. 1 Fig. 2 shows the schematic effects of increasing horizontal stress on the distributions of stress-aligned microcracks in almost all in situ rocks in a process referred to as Anisotropic Poro-Elasticity (APE) (Crampin & Zatsepin, 1997). The effects in Fig. 2 model the percentage shear-wave velocity anisotropy (1.5% to 4.5%SWVA) observed in the Earth (Crampin, 1994, 1999). Figure 2. Schematic (dimensionless) spatially-accurate illustration of anisotropic poro-elastic (APE) deformation of a random distribution of fluid-saturate stress-aligned vertical microcracks. Hexagons are isotropic, so for zero differential stress (top left), the solid lines are (a small selection of) randomly oriented cracks. A small increase of stress (top right) causes fluid to move between cracks, but if cracks remain open there is still no effective anisotropy. The first singularity occurs when increasing stress (normalised to one) is sufficient to close cracks normal to the stress (bottom left) and the percentage shearwave velocity anisotropy (%SWVA) jumps from zero to approximately the minimum ~1.5%SWVA observed in the Earth. Increasing stress further aligns microcracks, until at fracture-criticality (a second singularity), identified with the percolation threshold at ε = 0.055, (~5.5%SWVA) (not illustrated), there are through-going fluid pathways and the rock fractures, and are earthquakes if there is any disturbance. The behaviour is more fully described in Crampin & Gao (2013). (After Crampin & Zatsepin, 1997.) _________________________________________________________ The effects of increasing aspect ratio in stress-accumulation before earthquakes or eruptions can be monitored by measuring three-dimensional variations in SWVA in Band-1 directions for shear-waves propagating above swarms of small earthquakes, say. Fig. 3 shows the theoretical effects (Hudson, 1981) of increasing aspect-ratio (γ) and increasing crack density (ε) on seismic velocities over a range of angles from normal (0º) to parallel (90º) to the parallel fluid-saturated microcracks. In all cases, the variation of P-wave velocities is small and would be difficult to measure in complicated Earth structures. The wave trains of shear-waves however display SWS which can be easily recognised by distinctive orthogonal changes in direction in 2D plots of 3D particle motion. The variation of the split shear-wave polarized parallel to the cracks (SR) displays a cos(2θ) variation whereas the component perpendicular to the cracks (SP) displays a cos(4θ) variation. Crampin (1993) summarises the effects on seismic velocities of a variety of crack parameters. Note that microcrack crack densities in the Earth generally range from ε from 0.015 to 0.055 from analogy with ~1.5% to ~5.5% SWVA (Crampin, 1994, 1999). Fig. 3a and 3b shows the effects of doubling the crack density from a) ε = 0.02 to b) ε = 0.04 for thin cracks with aspect-ratio γ = 1/100. The effect of __________________________________________________________________________________________________________ Figure 3. Velocity variations through distributions of parallel vertical microcracks with angle from crack normal of P-waves and shear-waves propagating through an isotropic matrix rock (ρ=2.7g/cm3, Vp=6.3km/s, Vs=3.343km/s) typical of the crust. Phase velocities (solid lines) and group velocities (dashed lines are almost coincident. Crack parameters are: (a) crack density ε =0.02, aspect-ratio γ =1/100; (b) ε =0.04, γ =1/100; and (c) ε =0.02, γ =1/10, respectively. SR represents the split shear-wave polarized in the plane of the cracks and SP the split shear-wave perpendicular to the plane of the cracks. SWS time-delays in Band-1 directions are solid. (After Crampin & Zatsepin, 1997.) __________________________________________________________________________________________________________ doubling the crack density doubles the amplitude of the shear-wave (SR and SP) velocity variations where in particular the relative amplitudes of the SR and SP components remain similar. 2 Fig. 3a and 3c shows the effects of changing aspect-ratios from a) γ = 1/100 to c) γ = 1/10. The cos(2θ) variation for SR is independent of aspect-ratio, whereas the amplitude of the cos(4θ) variation for SP decreases significantly with increasing aspect-ratio. This means that the effect of increasing SWS time-delays in stress-accumulation before earthquakes or eruptions is to increase the average time-delay in Band-1 directions (the solid time-delays in Fig. 2). The effects on observations in three-dimensions is illustrated in the polar projections in Fig. 3. Figure 4. Equal-area polar projections out to 90º of a hemisphere of directions modelling the effects of SWS of the crack distributions in Fig.3: (a), (b), and (c), from top, where cracks strike E-W. (Left) horizontal polar projections of the polarizations of the faster split shear-waves; (Right) contoured SWS time-delays normalized to ms/km; (Centre) N-S cross-section of the contours in (c) where the solid areas of the cross-sections correspond to the solid areas in Fig. 2. Note that the amplitude of the middle cross-section is twice those at the top and bottom. The crossed lines mark the range of directions (N30ºW to N30ºE) where both SWS polarizations will be excited by a borehole source generating SH- or SV-waves. The inner circle in the projections is drawn (for scale) at an incidence angle of 35º (the theoretical shear-wave window at plane isotropic free-surface for a Poisson’s Ratio of 0.25). (After Crampin & Zatsepin, 1997.) _______________________________________________________________ Such increases in SWS time-delays monitoring stress-accumulation before earthquakes and volcanic eruptions have been observed in the field above swarms of small earthquakes in the successful stress-forecast of a M 5.0 earthquake in SW Iceland (Crampin et al., 1999, 2008), and further confirmed by retrospective stress-forecasts of ~17 earthquakes elsewhere (Crampin et al., 2015). However, although occasionally swarms of small earthquakes allow stress-accumulation to be monitored elsewhere, such swarms of small earthquakes are rare and routine monitoring will require the development of SMSs as suggested above. A further problem, that has only recently been recognized, but not yet analysed, is that the polarizations of shear waves and SWS at surface recorders are seriously disturbed by irregular topography around the recording site. This places further restrictions on monitoring SWS above swarms of small earthquakes and adds to the need for developing SMSs for stressforecasting impending earthquakes and volcanic erupions. Although a SMS with the optimum geometry in Fig. 1 has not yet been developed, a prototype SMS (where a DOV at 500 m-depth in one well in North-Central Iceland propagated shear waves horizontally to geophones at 500 m-depth in another well offset 315 m) was developed in the Húsavík SMITES experiment (Crampin et al., 2013). Simultaneous temporal variations in SWS time-delays were recorded, together with GPS variations and variations in water levels in well, correlated with a swarm of 106 small (M ≤2.8) earthquakes near the island of Grímsey on a neighbouring transform fault 70 km NNW with the effective magnitude of a single M ~3.5 earthquake. This demonstrated the viability of routinely stressforecasting impending earthquakes and eruptions with the ray-path geometry in Fig. 1. Correcting a misconception: SMSs do not and cannot measure stress. SMSs are designed to monitor changes of stress by using SWS to measure stress-induced changes to the fluid-saturated microcrack geometry that worldwide observations of SWS demonstrate exists in almost all crustal rock. 3 Appendix: Schematic illustration of ray-path geometry specifying the shear-wave window at the free-surface and Band-1 and Band-2 directions. Figure A1. Ray-path geometry for observing undisturbed SV-waves and SWS at a horizontal free-surface and identification of Band-1 and Band-2 directions in distributions of stress-aligned parallel vertical microcracks. ABSCD is a crack-plane through distributions of parallel microcracks and S is the recorder on the free-surface. Band-1 directions where SWS time-delays are sensitive to crack aspect-ratios (Crampin 1999) are within the solid angle EFGH-to-S subtending 15º to 45º to the crack plane with the effective straight-line shear-wave window (incidence within 45º). Band-2 directions to the free-surface are within the solid angle ADEHG-to-S subtending 15º to parallel to the crack plane. Both Band-1 and Band-2 directions include equivalent solid-angle directions reflected in the far side of the imaged crack plane. (After Crampin & Gao 2013.) ________________________________________________ References: † Crampin, S., 1993. A review of the effects of crack geometry on wave propagation through aligned cracks, Can. J. Expl. Geophys., 29, 3-17; currently available only at website. † Crampin, S., 1994. The fracture criticality of crustal rocks, Geophys. J. Int., 118, 428-438. † Crampin, S., 1999. Calculable fluid-rock interactions, J. Geol. Soc., 156, 501-514. † Crampin, S., 2001. Developing stress-monitoring sites using cross-hole seismology to stress-forecast the times and magnitudes of future earthquakes, Tectonophysics, 338, 233-245. Updated geometry online at website. † Crampin, S., Chastin, S. & Gao, Y., 2003. Shear-wave splitting in a critical crust: III - preliminary report of multi-variable measurements in active tectonics, Spec. Issue, J. Appl. Geophys., 54, 265-277. † Crampin, S. & Gao, Y., 2013. The New Geophysics, Terra Nova, 25, 173-180, doi:10.1111/ter.12030. † Crampin, S. & Gao, Y., 2014. New Geophysics: the opportunity to stress-forecast earthquakes and volcanic eruptions in North Iceland, in Proceedings of Workshop on Earthquakes in North Iceland (WENI1), 2013, Húsavík Academic Center, Iceland, 100-105. Crampin, S., Gao, Y. & Bukits, J. 2015. Retrospective stress-forecasting earthquakes and eruptions, Pure. Appl. Geophys., submitted (21/01.15) - under review (27/02.15). † Crampin, S., Gao, Y. & Peacock, S., 2008. Stress-forecasting (not predicting) earthquakes: A paradigm shift?, Geology, 36, 427-430. † Crampin, S. & Zatsepin, S.V., 1997. Changes of strain before earthquakes: the possibility of routine monitoring of both long-term and short-term precursors, J. Phys. Earth, 45, 1-26. † Crampin, S., Volti, T. & Stefánsson, R., 1999. A successfully stress-forecast earthquake, Geophys. J. Int., 138, F1-F5. Hudson, J.A., 1981. Wave speeds and attenuation of elastic waves in material containing cracks. Geophys, J. R. Astron. Soc., 64, 133-150. Leary, P.C. & Walter, L.A., 2005a. Physical model for the downhole orbital vibrator (DOV) – I. Acoustic and borehole seismic radiation, Geophys. J. Int.,. 163, 647-662. Leary, P.C. & Walter, L.A.., 2005b. Physical model for the downhole orbital vibrator (DOV) – II. Rotary correlation wavelets and time-lapse seismics, Geophys. J. Int., 163, 663-688. † Available at <www.geos.ed.ac.uk/homes/scrampin/opinion> 4
