Laboratory Reports - Anoka
advertisement
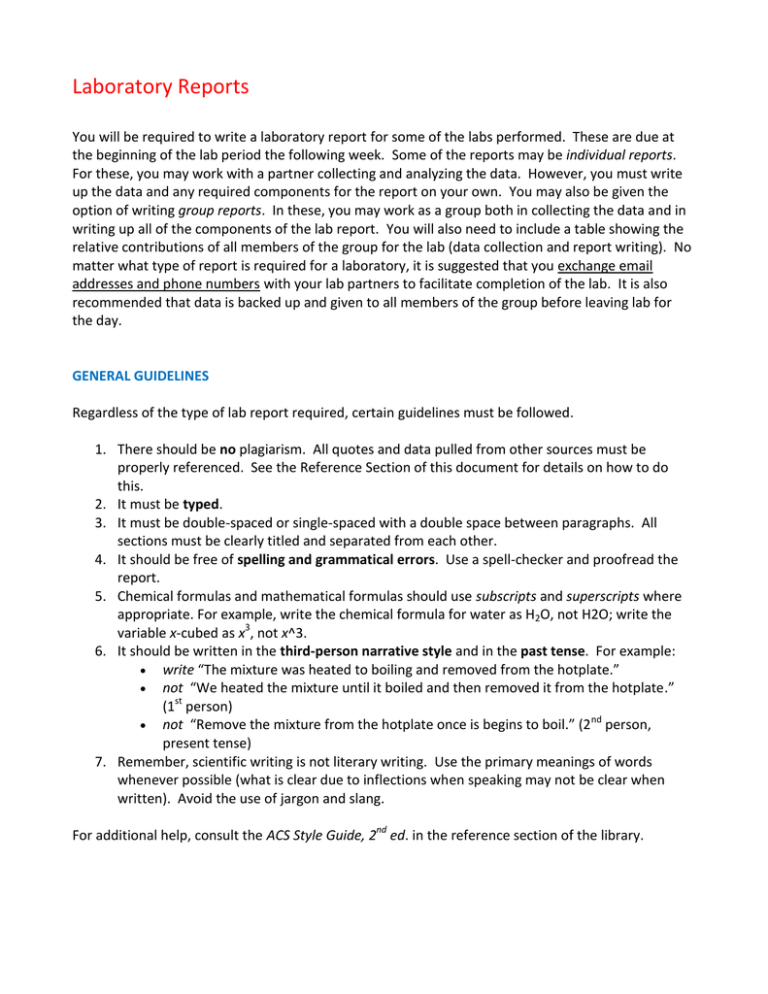
Laboratory Reports You will be required to write a laboratory report for some of the labs performed. These are due at the beginning of the lab period the following week. Some of the reports may be individual reports. For these, you may work with a partner collecting and analyzing the data. However, you must write up the data and any required components for the report on your own. You may also be given the option of writing group reports. In these, you may work as a group both in collecting the data and in writing up all of the components of the lab report. You will also need to include a table showing the relative contributions of all members of the group for the lab (data collection and report writing). No matter what type of report is required for a laboratory, it is suggested that you exchange email addresses and phone numbers with your lab partners to facilitate completion of the lab. It is also recommended that data is backed up and given to all members of the group before leaving lab for the day. GENERAL GUIDELINES Regardless of the type of lab report required, certain guidelines must be followed. 1. There should be no plagiarism. All quotes and data pulled from other sources must be properly referenced. See the Reference Section of this document for details on how to do this. 2. It must be typed. 3. It must be double-spaced or single-spaced with a double space between paragraphs. All sections must be clearly titled and separated from each other. 4. It should be free of spelling and grammatical errors. Use a spell-checker and proofread the report. 5. Chemical formulas and mathematical formulas should use subscripts and superscripts where appropriate. For example, write the chemical formula for water as H2O, not H2O; write the variable x-cubed as x3, not x^3. 6. It should be written in the third-person narrative style and in the past tense. For example: write “The mixture was heated to boiling and removed from the hotplate.” not “We heated the mixture until it boiled and then removed it from the hotplate.” (1st person) nd not “Remove the mixture from the hotplate once is begins to boil.” (2 person, present tense) 7. Remember, scientific writing is not literary writing. Use the primary meanings of words whenever possible (what is clear due to inflections when speaking may not be clear when written). Avoid the use of jargon and slang. For additional help, consult the ACS Style Guide, 2nd ed. in the reference section of the library. COMPONENTS OF THE LAB REPORT In a typical lab report submitted for publication in a scientific journal, there are a number of required components which are presented in a specific order: title, abstract, introduction, experimental procedure, results, discussion, conclusions, and references. Some reports also include appendices at the end. For a formal lab report (such as that required for the lab project), all of these components must be included. For the rest of the labs, only certain components will be required. These will be mentioned in the lab itself. Each of these components will be briefly explained in the following pages. The relevant portion of the sample lab report is also included for illustration. Title This component will be required for all labs. It can be at the top of the first page or on an additional sheet of paper (for a formal lab report). It should include the title of the experiment, the names of the people in the group, and the date the report was submitted. If the report is an individual report, the name of the person submitting the report should be listed first and underlined. Name is relevant to the experiment itself. Using Absorbance to Determine the Concentration of CuSO4 John Doe Sue Smith Submitted: 5/8/2013 Abstract An abstract is a short summary of the entire report. In scientific literature, it is often sited separately from the rest of the report and must therefore be able to convey the information contained in the report on its own. For this reason, even though it is the component that appears at the beginning of the report and is the first thing to be read, it is usually the last component that is written. The abstract is about one paragraph in length and usually contains 80 to 200 words. It covers four major points: a statement of the problem addressed or the purpose of the experiment, the experimental plan that was used, a summary of the main results, and a summary of the major conclusions. Each of these points should be summarized in one or two sentences. Typically, no references are contained in an abstract. Purpose of the experiment Main results This experiment was carried out to explore the relationship between the absorbance and concentration of colored solutions. After determining the λmax was 635 nm for CuSO4, the absorbance of six solutions of CuSO4, ranging from 0.00 to 0.50 M, was found using a colorimeter. Graphical analysis revealed that the relationship between absorbance and concentration was directly proportional with a molar absorptivity of 2.81 M-1cm-1. The data obtained reinforced the connection between the color of a solution and the wavelengths of light which the solution absorbs and reflects. In addition, knowledge of the linear relationship between absorbance and concentration allowed for the determination that unknown solution #285 was 0.726 M CuSO4. Brief experimental plan Major conclusions Introduction An introduction is used to bring the reader up to speed on any required background to understand the work that was done in this report and why it was done or why it is important. In a scientific journal where the targeted audience is familiar with the background, the introduction is typically one or two paragraphs long. First, the introduction needs to provide some background information so the reader will have a better understanding of the problem being studied and its significance. What is the historical basis for the experiment? Each experiment conducted is connected to a bigger picture, broader concept or problem. You need to provide this connection to the bigger picture by summarizing and citing pertinent literature. This can usually be accomplished in one or two paragraphs although it is certainly fine to have more. For the types of experiments done in class, your textbook will often provide a wealth of information. In addition, you may find material to use on credible websites. Having supplied background into the problem, one can then provide a basis for moving forward and doing the current experiment. This is where you will state the central “question” that you are addressing in the experiment and what your hypothesis was prior to completing the experiment. Make sure that the hypothesis is stated as a hypothesis and not as a known fact. You should also provide some brief reasoning to support why you believed the hypothesis was correct. It is also appropriate at this time, when relating your experiment to the broader context, to state how the current experiment differs from or is related to previous work that has been done and to indicate the scope or limits of your work. Background on some of the concepts in the experiment. The world is full of a multitude of colors that are used for both practical and aesthetic purposes. The colors that are seen when looking at different objects are due to the ability of the compounds in those objects to absorb specific wavelengths of light. In other words, the colors that are seen are the ones that are not absorbed. The wavelengths of light that are absorbed are determined by the electrons in a compound.1 As electrons move around, they can absorb energy and become excited. The energy, and thus the wavelength of light, the electrons absorb is determined by the type of atoms found in the compound and how those atoms are bound together. Different environments for electrons will also determine how much of a particular wavelength of light can be absorbed, a parameter which is reflected in the molar absorptivity of the compound.2 Because the color of a species is due to its ability to absorb light, the color should become darker or more intense as the concentration increases. The increase in concentration leads to more electrons in the sample which can then absorb more light at a particular wavelength. Thus, there should be a relationship between the concentration of the compound being studied and its absorbance. This relationship is best determined using a wavelength of light in a region of the visible spectrum where the maximum absorbance is observed. This wavelength is known as λmax and is most sensitive to the changes in concentration. Purpose and hypothesis for experiment The purpose of this experiment was to study the absorbance of CuSO4. Because copper compounds tend to be blue in color,3 it was hypothesized that the CuSO4 would have a λmax with a longer wavelength corresponding to a color more in the range of orange or red. Once the best wavelength for studying CuSO4 was determined, it could then be used to References examine the relationship between the absorbance and concentration of the compound and use that relationship to calculate desired information for unknown solutions. Experimental Procedure Depending on the journal being used, this section may also be called “Experimental Methods,” “Experimental Section,” or “Materials and Methods.” This section is used to describe how the experiment was conducted so that other experienced workers can repeat the experiment and obtain comparable results. All of the lab reports will contain an experimental details section of some type. Since this section is a description of what you did in the past, it must be written in past tense. Do not write it as a set of instructions as you might write a recipe. In other words, say things like “Three water samples were obtained and added…” Do not say “Take three water samples and add them to ...” Write in paragraph form and not in bulleted step-by-step form. When writing the experimental details, one describes what things were combined together, how they were worked up, and any unusual apparatus or equipment. If any standards or controls were used, these are described as well. It is not necessary to provide details on the procedures used if they are established and standard. For example, one would say that 15 g of NaCl was mixed with another chemical but would not describe how the NaCl was obtained. It is assumed that someone in a chemistry lab knows how to weigh out NaCl to obtain 15 g. It would also not be necessary to specify the type of container the NaCl was weighed in as someone doing the experiment should be able to identify an appropriately sized container. In this section, it is important to identify all materials used as they are used. For chemicals, the correct chemical names of each compound should be used along with the amounts (both the measured amount and the corresponding moles). If a solution is used, the concentration should be noted. If a product for a reaction is isolated, it is appropriate to mention any tests to confirm its identity or purity and to give a percent yield. For an apparatus, one can either describe how different pieces of equipment are connected or provide a figure with the details. For some of the labs, you will be following a standard method (the lab procedure). For these labs, it is sufficient to properly cite the appropriate literature (i.e.: the lab URL) and provide any additional details as needed for your particular completion of the lab. Note that it is 3rd person, past tense and written as a paragraph. Six samples were prepared for analysis by diluting a 0.50 M CuSO4 stock solution.4 Reference The amounts of the CuSO4 stock solution and water used in each sample is indicated in Table 1. A Vernier colorimeter was attached to the LabPro interface and the LoggerPro software was adjusted to display absorbances. The absorbance Concentrations and amounts of the 0.50 M CuSO4 was determined using a 1 cm cuvette at each of the four are given. wavelengths on the colorimeter (Appendix 1), and 635 nm was chosen as the λmax. The absorbance of each of the standard solutions was then determined at 635 nm. Unknown solution #285 was obtained and its absorbance was measured. Because No major results the absorbance was higher than that of the 0.50 M standard, the unknown was diluted in a 1:1 ratio with DI water, and the absorbance was measured again. are reported. Results The results section will be included in all of the lab reports for the semester. This component of the lab report provides a summary of the data collected and any statistical treatment done on that data. It does not contain statements of conclusion or interpretation as those are found in the discussion. A sample of each type of calculation should be included in this section as well. Begin this section with a few sentences that describe the nature of your results. This guides the reader through the data and provides some context for the numbers. Be sure to specifically refer the reader to any tables and graphs by name or number that are included, e.g. Table 1, Figure 1. Refer to graphs as Figures. These table and figure references are best accomplished by stating your results in a sentence and including the figure or table number in parentheses at the end of the sentence. For example, “The least amount of hydrogen was produced in the reaction that used the smallest amount of magnesium (Table 1)” sounds much better than “The results of the experiment are in Table 1.” Next, present the data in either table or graphical form. When providing the results, it is important to include only relevant data with sufficient detail to justify any conclusions you will make. It is up to you as the writer of the report to determine what is relevant, but bear in mind that you do not want to overwhelm the reader with the same material repeatedly. Also, you as the writer need to determine which format, table or graph, is the best for clearly representing the results for the reader. First major result is linear relationship. Provides key info on unknown and its value. The absorbances of the CuSO4 standard solutions were directly proportional to their concentrations (Table 1, Figure 1). The slope obtained for the graph is equivalent to the molar absorptivity since the cuvette had a pathlength of 1 cm. Thus, the molar absorptivity of CuSO4 at 635 nm is 2.81 M-1cm-1. This molar absorptivity could be used to determine the concentration of unknown #285. The absorbance of the undiluted solution was much higher (1.683) than the 0.50 M standard solution. After diluting 2.00 mL of the unknown with 2.00 mL of DI water, the absorbance obtained was 1.021. This corresponded to a concentration of 0.363 M CuSO4 for the diluted solution. The undiluted unknown #285 would therefore be twice that of the diluted, or 0.726 M CuSO4. Includes major conclusion from graph which is slope of line or molar absorptivity. Tables are used to present large amounts of numerical data, especially when that data is needed to calculate a result or when there are repeated trials. The tables themselves should have titles and the columns or rows should have labels which include any appropriate units. As it is often confusing for the reader to look at a large group of numbers, it is good to summarize the main information of the table (such as the average volume or density that you were calculating) in the paragraphs describing the nature of your results. When submitting reports electronically, it is often advantageous to embed Excel tables in your Word documents and use formulas in the cells for the sample calculations. Table 1. Preparation of standard CuSO4 solutions and their absorbances at 635 nm. Concentration of Volume of 0.50 Title is Standard CuSO4 M CuSO4 Stock Volume of DI Absorbance Column headings are relevant to Solution (M) Solution (mL) Water (mL) at 635 nm relevant and include the data. 0.00 0.00 5.00 0.000 units. 0.10 1.00 4.00 0.406 0.20 2.00 3.00 0.638 Numbers have 0.30 3.00 2.00 0.854 correct sig figs. 0.40 4.00 1.00 1.202 0.50 5.00 0.00 1.276 Graphs convey experimental relationships very effectively as a picture. Many of the graphs you will use in this class will be scatter graphs. With a scatter graph, a trendline analysis will typically be done on the data and this trendline should be included in the graph as well. Again, it is good to summarize the data when describing the nature of the results. What type of relationship was observed? Linear? Polynomial? What was the equation for the relationship? If no trendline could be obtained, at what value did the graph level off? Each axis is labeled and includes units as appropriate. Trendline equation is present with appropriate sig figs and labels. Title is relevant to the data (not just y vs. x). Figure 1. Determination of molar absorptivity of CuSO4. The blue diamonds are from the standard solutions. The red square is the diluted sample of unknown #285. Sometimes the reliability or validity of the data is questionable because of procedural mistakes or other unplanned happenings. Inform the reader if this is the case. However, always present the data or observations that you actually obtained. Do not omit or make-up data because you thought you obtained bad data. Instead, include the numbers in the table or graph, but add a statement on whether or not the questionable data point was included in the average or the trendline and why. Discussion The purpose of this component is to analyze, interpret and compare the results of the experiment. You have just finished stating what the results of the experiment are, now you need to convey to the reader what they mean. As such, it is probably one of the most important parts of the lab report. Begin by reminding the reader of the problem you were investigating and your hypothesis or predictions. Then describe whether your results supported or contradicted your hypothesis. You need to specifically state how or why your data supported your hypothesis or predictions, or didn’t support them if that is the case. It is critical to be objective at this point. Never base your conclusions on how you thought the experiment should have turned out. Explain how your results led you to your conclusion. It may be helpful to ask yourself, “What evidence do I have?” “How do I know” or “Why am I making this conclusion?” Often in the process of describing how your results led to your conclusion, it is useful to explain your conclusion in more detail. This is true whether you have discovered something totally new or simply verified a tenant of chemistry. One way to do this is to compare your results to the literature, often your textbook. Another is to extend your results and conclusions by applying them to the real world. You could also identify additional experiments that could be done or hypotheses that could be tested to learn more about the topic being investigated. It is also prudent to address experimental difficulties or limitations of the results. Sometimes investigations are inconclusive. This is okay as long as you speculate on why the results did not support your hypothesis or prediction. Identify alternative explanations that would account for unexpected patterns. Simply stating that “human error may have occurred” or “the balances might have been off” does not suffice. If you noticed something was wrong during the experiment, you should have fixed it and have correct results. If you noticed something incorrect in the data after the experiment, you should be able to describe what was off and how that affected the final results. If there is a better or different way to do the experiment, it should be noted. If the original hypothesis was incorrect, a new one should be proposed. Reminds readers of purpose or hypothesis. Second point of the experiment-info and explanation. The purpose of this experiment was two-fold: to determine the λmax and molar absorptivity of CuSO4 and to use that information to establish the concentration of First point of the an unknown CuSO4 solution. It was assumed that the CuSO4 solution, being blue in experiment--info and explanation. color, would reflect lower wavelengths of light which correspond to the blue color and absorb better at higher wavelengths of light. This was supported by the results of the experiment. Of the four wavelengths available on the colorimeter (430 nm, 470 nm, 565 nm, and 635 nm), the greatest absorbance was observed at 635 nm (Appendix 1). Thus, the λmax for the solution was determined to be 635 nm which References corresponds to a red color.5 The absorbance of each of the standard CuSO4 solutions was measured at 635 nm to determine the molar absorptivity of CuSO4 at this wavelength. As shown in Figure 1, absorbance and concentration were directly proportional to each other. Based on Beer's Law (A = εcl),4 the slope of the line should be equal to the molar absorptivity multiplied by the cell pathlength. Since the cell pathlength for this experiment was 1 cm, the value of the molar absorptivity was equal to the slope of the line. Thus, it was determined that the molar absorptivity of the CuSO 4 at 635 nm was 2.81 M-1cm-1. One factor that is obvious from Figure 1 is that the data was not as precise as desired based on the R-squared value of 0.96 obtained for the trendline analysis. It is assumed that the inconsistencies in the data were due to errors in the dilution of the stock solution when making the standard CuSO4 solutions. Because no dilution was necessary for the 0.00 M and 0.50 M CuSO4 solution, these two data points can be understood to be correct. If one imagines a line connecting these two data points, all of the other points would be above the line, meaning that their absorbances are greater than predicted for the concentrations. This would suggest ... Application of data and naturally working in question answers. Error analysis and how/why data might be off. The molar absorptivity determined from the standard CuSO4 solutions can be used to calculate the absorbance of a known CuSO4 solution or the concentration of an unknown CuSO4 solution. For example, while a 0.25 M CuSO4 solution was not used as a standard, its absorbance can be predicted to be 0.703 in a 1 cm cuvette: A = εcl A = (2.81 M cm-1)(0.25 M)(1.0 cm) A = 0.703 -1 Likewise, for unknown #285, the concentration could be determined. Because the Third point of concentration of the unknown was greater than the 0.50 M CuSO4 standard, the the experiment-unknown was diluted with DI water in a 1:1 ratio. This resulted in a diluted solution with sample with an absorbance of 1.021. Using Beer's Law, the concentration could then be calculation and calculated: evaluation. c = A/εl c 1.021 (2.81M cm1 )(1.0 cm) 1 c = 0.363 M Because of the 1:1 dilution of the unknown with water, the concentration of the undiluted solution #285 would be twice that of the diluted solution, or 0.726 M CuSO4. Although this does fit well with the standard solutions, it has already been noted that the trendline analysis was not very accurate. Therefore, it is likely that true value of the unknown concentration is slightly greater than 0.726 M. Conclusion Depending on the length of the report, the conclusion can either be a separate section or combined with the discussion. The conclusion is usually just one paragraph in length and restates the main points of the discussion as a summary of the report. Restate three main conclusions of lab. Solutions of CuSO4 absorb more light at higher wavelengths than at lower wavelengths, corresponding well with the blue color of the solution. The molar absorptivity of CuSO4 at 635 nm is 2.81 M-1cm-1. Knowledge of this value allows for the determination that unknown #285 is at least 0.726 M CuSO4. References When writing a paper of any type, it is always important to document outside sources of information. While there are many ways to include citations, we will be using the format of the American Chemical Society which is to use superscripted numbers, usually at the end of the sentence or clause to which it applies. The first reference in a paper is given the number “1” and subsequent references increase sequentially. If a reference is repeated, it uses the same number it had earlier. For example: The density of the unknown was closest to that of hexane.1 The expected pH of each solution was calculated using known Ka values.2 The actual references themselves are compiled in the reference section at the end of the report. Each reference is preceded by its reference number in parentheses. The different components of the reference are then provided in a standard format. Please note that if you have a reference listed in this section, it must refer to a specific point which has been noted with a superscripted number in the body of the report. Examples of different types of references are listed below. INTERNET REFERENCE Author; author (if known). Organization or Institution. Title of Web Page. URL Signature found at the bottom of the page (date accessed). (1) Anoka-Ramsey Community College. Microscale Density and Refractometry. http://webs.anokaramsey.edu/chemistry/chem1061/Labs/MicroscaleDensity/MicroscaleDensityvm.pdf (accessed Aug 23, 2004). BOOK REFERENCE-SINGLE AUTHOR(S) Author. Title of book, edition; Publisher: Place, Year. (2) Tro, N.J. Principles of Chemistry: A Molecular Approach, 1st ed.; Prentice Hall: New York, 2010. BOOK REFERENCE-CHAPTER IN AN EDITED BOOK Author; author. Title of chapter. In Title of book; Editor, Ed.; Publisher: Place, Year; Volume; Pages. (3) Gbalint-Kurti, G. G. Wavepacket Theory of Photodissociation and Reactive Scattering. In Advances in Chemical Physics; Rice, S. A., Ed.; Wiley: New York, 2004; Vol. 128; p 257. BOOK REFERENCE-ARTICLE FROM A REFERENCE BOOK Title of Article. Title of book, edition; Publisher: Place, Year; Volume, Pages. (4) Powder Metallurgy. Kirk-Othmer Encyclopedia of Chemical Technology, 3rd ed.; Wiley: New York, 1982; Vol. 19, pp 28-62. ARTICLE REFERENCE FROM A SCIENTIFIC JOURNAL Author; author. Title of Article. Journal. Year, Volume, Pages. (5) Evans, D. A.; Fitch, D. M.; Smith, T. E.; Cee, V. J. Application of Complex Aldol Reactions to the Total Synthesis of Phorboxazole B. J. Am. Chem. Soc. 2000, 122, 10033-10046. ARTICLE REFERENCE FROM A NON-SCIENTIFIC JOURNAL Author; author. Title of Article. Journal, Date, Pages. (6) Manning, R. Super Organics. Wired, May 2004, pp 176-181. All references point to a particular item in the report which is also numbered. (1) Cornell University. http://www.ccmr.cornell.edu/education/ask/?quid=1297 (accessed May 7, 2013). (2) Biology Online. http://www.biology-online.org/dictionary/Molar_absorptivity (accessed May 7, 2013). (3) Western Oregon University. Transition Metal Complexes and Color. http://www.wou.edu/las/physci/ch462/tmcolors.htm (accessed May 7, 2013). References are in the order in which they appear in the paper. (4) Anoka-Ramsey Community College. Determining the Concentration of a Solution: Beer's Law. http://webs.anokaramsey.edu/chemistry/Chem101/Labs/BeersLaw/BeersLawS13. pdf (accessed May 1, 2013). (5) Visible Spectrum. http://www.giangrandi.ch/optics/spectrum/spectrum.shtml (accessed May 7, 2013). Appendix An appendix is included at the end of a report if there is additional data to be presented which does not “fit” in the report itself. For this class, there may be two things included in the appendix. The first are the data tables used to generate the graphs presented in the results section. They normally would not be included in a report, but the instructor will want to check the data to make sure it is correct so it will be included in the appendix. These data tables may be referenced in the same way in which data tables were referenced in the results section with the exception that they are now referred to as an “Appendix.” For example, “A linear relationship was found between rate and time (Figure 2, Appendix 1).” The second will be questions you are asked to answer that are related to the concepts of the lab but were not part of the main focus of the lab and would therefore disrupt the flow of the report. If this is needed in a particular report, it will be mentioned in the lab itself. Data from lab which doesn't fit in with report itself but was necessary for results obtained. Appendix 1. Determination of λmax for 0.50 M CuSO4. Wavelength Absorbance (nm) 430 0.000 470 0.001 565 0.796 635 1.276 Appendix 2 To prepare 700.0 mL of 0.30 M CuSO4, you would need to use 33.5 g of CuSO4 and add DI water until you obtain 700.0 mL of solution. 0.30 molCuSO4 159.62 g CuSO4 0.7000 L 33.5 g CuSO4 1L 1 molCuSO4 Question completed in lab which doesn't flow well with the report. Portions of this description were obtained from The ACS Style Guide, 2nd ed.; Dodd, J.S., Ed.; American Chemical Society: Washington D.C., 1997.
