Rheology of Thermoplastic Polymers: Viscosity & Elasticity
advertisement
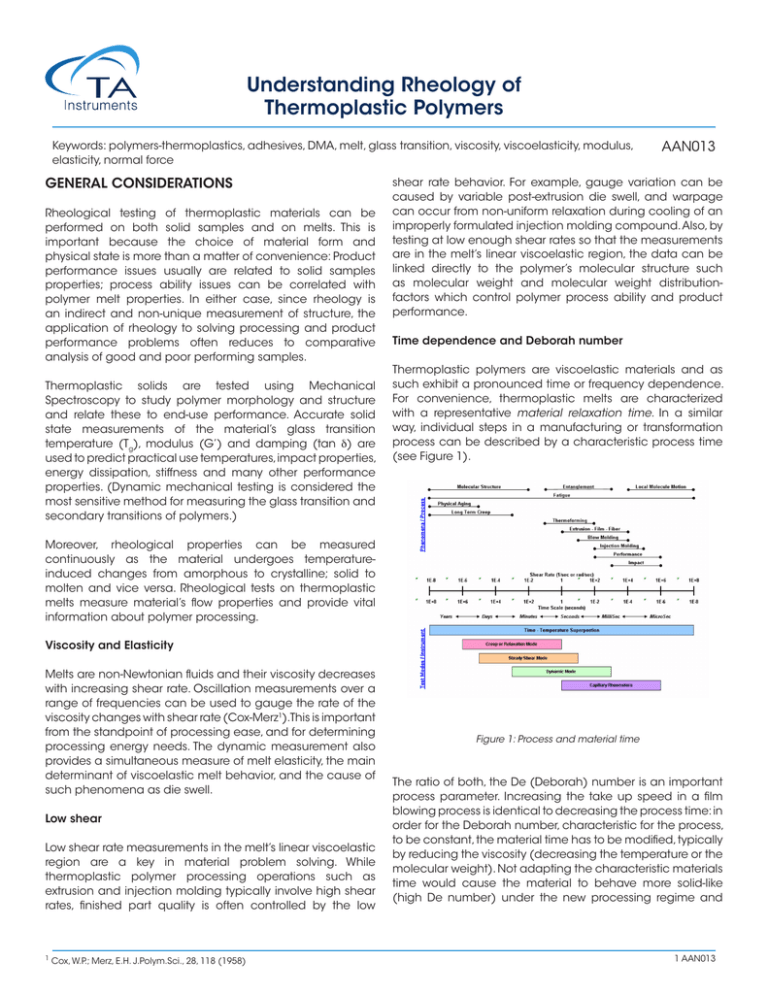
Understanding Rheology of Thermoplastic Polymers Keywords: polymers-thermoplastics, adhesives, DMA, melt, glass transition, viscosity, viscoelasticity, modulus, elasticity, normal force GENERAL CONSIDERATIONS Rheological testing of thermoplastic materials can be performed on both solid samples and on melts. This is important because the choice of material form and physical state is more than a matter of convenience: Product performance issues usually are related to solid samples properties; process ability issues can be correlated with polymer melt properties. In either case, since rheology is an indirect and non-unique measurement of structure, the application of rheology to solving processing and product performance problems often reduces to comparative analysis of good and poor performing samples. Thermoplastic solids are tested using Mechanical Spectroscopy to study polymer morphology and structure and relate these to end-use performance. Accurate solid state measurements of the material’s glass transition temperature (Tg), modulus (G’) and damping (tan δ) are used to predict practical use temperatures, impact properties, energy dissipation, stiffness and many other performance properties. (Dynamic mechanical testing is considered the most sensitive method for measuring the glass transition and secondary transitions of polymers.) AAN013 shear rate behavior. For example, gauge variation can be caused by variable post-extrusion die swell, and warpage can occur from non-uniform relaxation during cooling of an improperly formulated injection molding compound. Also, by testing at low enough shear rates so that the measurements are in the melt’s linear viscoelastic region, the data can be linked directly to the polymer’s molecular structure such as molecular weight and molecular weight distributionfactors which control polymer process ability and product performance. Time dependence and Deborah number Thermoplastic polymers are viscoelastic materials and as such exhibit a pronounced time or frequency dependence. For convenience, thermoplastic melts are characterized with a representative material relaxation time. In a similar way, individual steps in a manufacturing or transformation process can be described by a characteristic process time (see Figure 1). Moreover, rheological properties can be measured continuously as the material undergoes temperatureinduced changes from amorphous to crystalline; solid to molten and vice versa. Rheological tests on thermoplastic melts measure material’s flow properties and provide vital information about polymer processing. Viscosity and Elasticity Melts are non-Newtonian fluids and their viscosity decreases with increasing shear rate. Oscillation measurements over a range of frequencies can be used to gauge the rate of the viscosity changes with shear rate (Cox-Merz1).This is important from the standpoint of processing ease, and for determining processing energy needs. The dynamic measurement also provides a simultaneous measure of melt elasticity, the main determinant of viscoelastic melt behavior, and the cause of such phenomena as die swell. Low shear Low shear rate measurements in the melt’s linear viscoelastic region are a key in material problem solving. While thermoplastic polymer processing operations such as extrusion and injection molding typically involve high shear rates, finished part quality is often controlled by the low 1 Cox, W.P.; Merz, E.H. J.Polym.Sci., 28, 118 (1958) Figure 1: Process and material time The ratio of both, the De (Deborah) number is an important process parameter. Increasing the take up speed in a film blowing process is identical to decreasing the process time: in order for the Deborah number, characteristic for the process, to be constant, the material time has to be modified, typically by reducing the viscosity (decreasing the temperature or the molecular weight). Not adapting the characteristic materials time would cause the material to behave more solid-like (high De number) under the new processing regime and 1 AAN013 lead to reduce performance and eventual breaking of the film. A low De number stands for a predominately viscous behavior, a high De number for an elastic material response. ~Mwa with a = 3.08 ± 0.39 in this example Molecular Weight Distribution Shear and Elongation Also most rheological tests are done in shear using rotational or capillary rheometers, process flows are usually mixed flows with elongation deformations being important and dominant in processes like film blowing, blow molding, fiber spinning, etc. The elongation viscosity of elastic materials at large deformations can deviate significantly from the shear viscosity and therefore is an important parameter to predict processing performance or to design process equipment. Elongation properties at large deformations correlate with molecular structure. The elongation viscosity as such is a very sensitive indicator of long chain branching EFFECT OF MOLECULAR MORPHOLOGY STRUCTURE AND Beyond the Newtonian region, melt viscosity drops with increasing shear rate, a phenomenon called shear thinning. This behavior is considered the most important non-Newtonian property in polymer processing because it speeds up material flow and reduces heat generation and energy consumption during processing. At constant molecular weight, the amount of energy required to process the polymer is directly related to the viscosity’s shear rate dependence. The onset and degree of shear thinning vary among materials and qualitatively correlate with the molecular weight distribution: Polymers with a broad distribution tend to thin more at lower shear rates than those with a narrow distribution at the same average Mw. (Figure 3). Molecular Weight Molecular weight is the main structural parameter of polymers’ flow behavior at temperatures above the glass transition temperature (for an amorphous material) or the melting point (for a semi-crystalline polymer). Melt viscosity is a constant at low shear rates or frequencies. The viscosity in this region is known as the zero shear, or Newtonian, viscosity ho. For low molecular weight polymers in which chain entanglement is not a factor, the zero shear viscosity is proportional to the polymer’s molecular weight. However, above a critical molecular weight, chains begin to entangle and the zero shear viscosity depends much stronger on molecular weight, proportional now to about the 3.4 power of the molecular weight. This is shown in Figure 2. Rheological measurements are therefore ideal for studying the effects of molecular weight differences in resins as small differences in molecular weight are manifested in large changes in viscosity. Figure 3: Molecular weight distribution differences in polymer melts are easily detected by measuring the complex viscosity η* as a function of frequency. Some important consequences of this: molding and extrusion can for example be made easier by broadening a polymer’s molecular weight distribution; finished product characteristics, such as sag and haze in blown LDPE films, or surface smoothness in a variety of thermoplastic molded goods can be altered by changing molecular weight distribution. The slope of the modulus versus the frequency curve for a melt also mirrors changes due to molecular weight distribution. Isothermal measurements of the modulus at frequencies below one reciprocal second show marked increases in the storage modulus as distribution is broadened. Such changes have been used to distinguish between good and poor performing products and guide subsequent product improvements through adjustments in molecular weight distribution (Figure 4). Figure 2: The zero shear viscosity is a sensitive measure of polymer molecular weight. The relationship for flexible linear polymers is ηo 2 AAN013 Figure 4: Molecular weight distribution differences in polymer melts show best in the terminal region of the storage modulus G’. A good indicator of MWD changes is the cross over modulus Gc. Figure 6: Elongation viscosity of LDPE (branched) and LLDPE (linear) show pronounced differences at high total strains. This strain hardening effect is a characteristic feature of long chain branching Fillers Branching Polymer chain branches can vary in number, length and distribution along the main chain. Increasing the number, the size, or the flexibility of the branches changes the melt viscosity. But if the branches are few and long enough to entangle, melt viscosity will be higher at low frequency than that of a corresponding linear polymer of the same molecular weight (Figure 5). The viscosity of long-branched polymers is more shear rate dependent than is the viscosity of linear polymers and long chain branching affects the elasticity of the polymer melts which shows in the normal stress difference and the storage modulus. Adding fillers to a neat polymer melt changes its rheology, influencing both the way the melt processes and the properties of the ultimate product. Key factors are filler size and shape, filler concentration, and the extent of any interactions among the particles. The consequences of adding fillers are an increase in melt viscosity and a decrease in die swell. Moreover do particle interactions increase the non-Newtonian range and cause it to occur at a lower shear rate than for the unfilled polymer melt. Filled polymers have a higher viscosity at low shear rates, and yielding may occur with increased filler concentration (Figure 7). At higher shear rates the effect of the filler decreases and the matrix contributions dominate. Another effect of the filler is the reduction of the linear viscoelastic range, characterized by the onset of the strain dependent behavior. Figure 5: Effect of branching on the complex viscosity η* and the dynamic moduli G’, G”” The extensional viscosity at high strains increases strongly with long chain branches. Figure 6 compares the rheological responses of a long chain branched LDPE and a linear LLDPE in elongation. The pronounced viscosity increase at large elongation strains (strain hardening) is characteristic for long chain branching. Figure 7: The viscosity of a highly filled LDPE exhibits yielding at low shear rates Blends Polymer blends are compositions of chemically different polymers. Polymer blends are homogeneous if the components are compatible and mix at molecular level. 3 AAN013 Blends are heterogeneous or incompatible if the components are present in separate phases. Usually the minor component is dispersed in a matrix of the dominant component. Whether a blend is compatible or not, also depends on temperature; in this case the blend is considered partially miscible. If blends are incompatible, mechanical energy is needed to disperse the minor phase (mixing) and coalescence occurs if the blend morphology is not stabilized. Interfacial forces such as the interfacial tension become important and can change the rheological signature of the blend significantly. Moreover, the elastic properties of non-compatible blends depend on energy storage mechanisms at the interphase.The relaxation of the dispersed phase itself is often much longer than the relaxation of the polymer chains of the individual components. Figure 8 shows the dynamic spectrum of a PMMA/PS blend with different volume fractions of the minor phase2. The additional low frequency contributions in G’ are due to the form relaxations of the large dispersed domains of the minor phase. If the average droplet size is known (from TEM for example), the interfacial tension can be calculated from the average relaxation time of the droplet relaxation. Figure 9: PPO/HIPS blend modified with MBS. The additional transition at -45°C independent of concentration proves poor compatibility3 Blending also provides a means to modify the elastic modulus. Pressure sensitive adhesives PSA have the best adhesion properties when the modulus is between 5x10⁵ and 105 Pa at use temperature. By varying the content of tackifying resins in a natural or synthetic rubber matrix, the modulus can be adjusted as required (Figure 10). Figure 8: The increase contributions of G’ at low frequency can be used to calculate the interfacial tension of non-compatible blends2 Incompatible blends show distinct glass transitions for each component. However, the value may change in relation to the pure components. Homogeneous blends exhibit only one glass transition. Thus the evaluation of the glass transitions provides information about compatibility and interphase effects. Figure 9 shows the tan δ trace of an PPO/HIPS 50:50 blend, modified with MBS a (methyl-metacrylatebutadienestyrene) copolymer3. The modifier shows as an additional transition at -45°C, independent of the concentration. The poor compatibility is a result of the specific structure of the MBS, which consists of a PMMA shell imbedding a core of SB rubber. Figure 10: Comparison of PSA adhesive based on natural rubber and SIS copolymers. The SIS-based adhesive exhibits a wider application window (constant G’= 105 Pa) Process flows induce orientation of the dispersed phase in noncompatible blends.As a result of this fact, the morphology can be modified to change the final product specific properties; a good example is the improved gas barrier in blow molded beverage bottles. Since non-compatible blends undergo coalescence in the melt state, compatibalizers such as copolymers are added to stabilize the morphology. Another technique to stabilize the morphology is reactive blending, which involves in situ chemical reactions at the interphase. APPLICATION EXAMPLES Processing Molecular structure and ability to process Rheological measurements are extensively used to study 4 AAN013 polymer melts. The parameters obtained describe the fundamental behavior of materials such as ABS, PVC, polyolefin, etc. In processes such as bottle blow molding, injection molding, sheet forming, cable jacket extrusion, fiber spinning, etc., rheological measurements correlate molecular structure, MW, MWD and LCB to such processing behavior as flow rate, die swell, melt stability, recoverable shear and frozen-in stresses. Figure 11 shows melt viscosity and the first normal stress difference data, measured in cone plate. The two HDPE’s M-1 and M-2, which were found to be very similar by capillary viscometry and even GPC, yet they perform quite differently in a standard bottle blowing line4. M-2 produced significantly heavier bottles. Although the viscosity and the molecular weight distribution (see Table 1 below the Figure 11) of these two materials are almost identical, the normal stresses reported differ significantly. The measured normal stress difference correlates well with the parison swell - a difference in long chain branching or a small amount of high molecular weight component may be the origin. Due to the increased die swell, the parison is thicker, therefore the increased weight of the bottle. In order to evaluate the effect of long chain branching, uniaxial elongation viscosity measurements in the melt can be performed. Data are shown in Figure 12 for three polyethylenes, an LDPE, a HDPE and an LLDPE5. The LDPE shows an pronounced strain hardening, i.e. a significant increase of the viscosity with increasing Hencky deformation. This strain hardening stabilizes the parison - the wall thickness of the bottle during blow molding or the free film in a film blowing process becomes more uniform. Strain hardening with a minimum of die swell and enough viscosity to prevent sagging of the parison are the design criteria for a good blow molding compound. The HDPE does show much less strain hardening and the LLDPE follows closely the trace of 3 times the zero shear viscosity. The LLDPE also reaches steady state much faster than the HDPE and the LDPE. TABLE 1 M-1 M-2 MF1 (190; 2.16) 0.6 0.5 GPC (Mw) 131 500 133 600 (Mz) 907 000 1 035 000 η (@ 1s ) 84 000 83 000 η (@ 100s1) 10 200 9 500 Swell (%) 28 42 1 Figure 12: Shear and elongation viscosity for LDPE, HDPE and LLDPE5 Rheology during injection molding - effect on residual strains For high viscosity melts such as filled thermoplastics or unvulcanized elastomers, cone plate measurements suffer from difficulties forming the sample prior testing as well as edge effects at higher shear rates during testing. Oscillation measurements, probing the material with a sinusoidal shear deformation using parallel plates instead of cone plate, are much easier to perform. Figure 13 shows the dynamic mechanical characterization of an injection molding grade ABS. Capillary viscosity data compare well with the absolute values of the complex viscosity, as suggested by Cox and Merz1 and found by many others in unfilled systems. Figure 11: Shear viscosity and first normal stress difference of two blow molding polyethylenes M- 1 and M- 2 exhibiting significant process performance4 Figure 13: Oscillation and capillary data for an injection molding ABS compound. Cox-Merz η*(w)= η (γ) holds1 In addition to the viscosity, an oscillation measurement 2 3 Friedrich, C. et all., J.Rheol. 39, (6), 1411 (1995). Ma, C.C.M., et all. Advances in Polymer Blends and Alloys, Vol. 22, A Technomic publication ISBN 87762-670-7 5 AAN013 provides also a measurement of the materials elasticity, represented by the storage modulus G’. G’ correlates with the flow behavior in the mold and strongly influences the relaxation behavior and consequently orientation and frozen-in strains. Relative warpage effects and melt strength depend also on the elastic nature of the polymer melt and the resultant flow behavior in the mold. Sporadic surface crazing and cracking problems on the molded ABS parts are a result of too much orientation and residual strains. Torsion tests on the solid sample in the glass transition region can be used to quantify the amount of residual strains in an injection molded part. The proof is given in Figure 14, showing a DMA trace on freshly molded samples and on companion pieces annealed under vacuum for eight hours at 180°C. The storage modulus G’ and tan δ were measured at a frequency of 1 Hz and a strain of 0,07% at temperatures from 120°C to 130°C. Clear differences were found between the annealed and unannealed samples near the main glass transition: the sample with residual strains had a higher tan δ over a wide range of temperatures below the glass transition temperature Tg. This relates to the relaxation of the backbone conformations of the oriented styreneacrylnitrile component in the continuous phase. The intensification of the loss dispersion just below the glass transition is a sensitive monitor of molecular orientations in polymers. Figure 14: Effect of annealing on loss tangent of an injection molded ABS part Melt degradation of PVC Figure 15: PVC melt stability followed in oscillation for sample A and B at different temperatures Extrusion problems of thermoplastic melts The extrusion of thermoplastics is a high shear process. However, this does not mean, that extrudate problems are associated with high shear rate phenomena. As soon as the extrudate emerges from the die, the shear rate declines considerably - the extrudate swell is a comparable low rate phenomenon. Figure 16 shows the storage modulus as a function of frequency, obtained from dynamic mechanical tests on two grades of polyurethanes, used for medical tubing. The specifications call for tight tolerances in diameter and wall thickness. The material with the higher G’’ provides too thick, the one with the lower G’ too thin tubing. Under identical processing conditions, the small difference in elasticity represented by G’ is enough to cause the tubing to be off spec as a result of variations in die swell. During extrusion through the die, the polymer orients and builds up internal strains. As the polymer leaves the die, these strains recover and the polymer swells. The degree of swelling depends on the ability of the material to store deformation energy, the shear rate and the residence time in the die. In the material, the distribution of molecular weight and the degree of branching affects the degree to which internal strains form and recover. Because G’ is related to the amount of stored energy during the deformation, it provides an estimate of to the degree of recovery of the PU resin. The greater G’, the higher the die swell, the thicker the tubing. Important in nearly all melt processing operations, melt degradation can readily be followed by recording the dynamic moduli at constant frequency continuously as a function of time at process temperature. PVC is particularly sensitive to process temperature, as shown in Figure 15 for the two injection molding compounds A and B. The two compounds differed in flame retardant additives and color concentrate. The effect on the thermal stability is dramatic. Sample A shows in comparison to sample B rapid degradation after 20 minutes at 215°C, represented by a steep increase in viscosity. Figure 16: Two grades of extrusion polyurethane. The grade with the higher elasticity (G’) produces the thicker tubing 4 5 Macosko, C.W.; Lorntson, J.M. private communication (1973) Meissner, J. presented at Tezukayama College, Nara, Japan, October 1994 6 AAN013 Pipe surface quality defects can also be traced back to small variations of the melt elasticity.Too high elasticity, measurable by the storage modulus at low frequency, (Figure 17) causes rough surfaces during extrusion of HDPE pipes. Reducing the elasticity by using an HDPE with a narrower molecular weight distribution eliminated the problem. Note that small variations of the molecular structure, caused by, for example, tiny amounts of a high molecular polymer may cause significant processing problems. These variations are usually not detectable in MI values or standard SEC analysis. Figure 18: Modulus and damping of PP fibers, drawn in a one and a two stage process down to the same extent. A smaller damping peak stands for higher crystallinity and fiber strength8 Figure 17: The elasticity, characterized by G’, correlates with the surface quality of HDPE during extrusion. A rough surface corresponds to a high G’. Performance Effect of multi-stage drawing and moisture on the morphology of fibers The morphology and final performance of synthetic fibers depend to a large extent on their processing conditions. The extent and rate of draw is an important variable, with significant effects on the final properties. The drawing process results in molecular orientation and may enhance crystallization as well as orient the crystals themselves6. Both phenomena impart high strength and can affect enduse performance. The glass transition is a good indicator of morphological changes and the change in size of the transition can be related to changes in crystallinity7. Figure 18 shows the elastic modulus and the damping of two fibers from the same PP grade drawn down to the same extent; one fiber was drawn down by a one stage process while the second was produced in a two stage process. The two stage drawn fiber has a higher elastic modulus at temperatures above the glass transition (-11.5°C). This can be related to increased crystallinity due to a higher degree of orientation8. Although the glass transition at -11.5°C is the same for the two fibers, does the two-stage drawn fiber show a smaller damping peak which also indicates a higher crystallinity. If crystalline and amorhous phases coexist in a material, then a reduced damping peak corresponds to an increased degree of crystallinity. These crystalline regions act as crosslinking points that inhibit the sliding motion of the molecular chains, thus providing a fiber which exhibits greater strength. In condensation products such as nylon, the moisture content of the resin is a critical variable. In Figure 19, the DMA traces of nylon fibers made from moist and pre-dried pellets in an extrusion process are shown. The elastic modulus of the moist pellets has a higher value above the glass transition, which is evidently due to crosslinking reactions during the extrusion process. On the tan δ curve, both Tg and the ß transition occur at the same temperature. Clearly the predried sample has a higher damping peak than did the moist sample. Since the moisture content can affect the degree of crystallinity, the pre-dried sample would produce a fiber with a lower degree of crystallinity. In this situation, the moisture plasticizes the nylon and greatly increases the crystallization kinetics. Figure 19: DMA trace of Nylon fibers. Moisture enhances the crosslinking reactions during extrusion and increases the modulus above Tg. The higher damping at the transition for the dry sample is due to lower crystallinity Improving the Impact Behavior of Polystyrene Juice Cans Orange juice can molded from rubber-modified high impact polystyrene (HIPS) resins exhibited variations in impact resistance. High impact phenomena are related to mechanical deformations in the order of milliseconds. Due to the equivalence of time and temperature, fast mechanical 7 AAN013 processes at ambient temperature correlate with low speed testing at low temperature. As such energy absorption, represented by the magnitude of tan δ at the ß peak, measured at frequencies of 1Hz correlate to toughness and impact resistance (Figure 20). The shift in the glass transition temperature Tg and the ß peak is due to compounding effects either to compatibilization of the rubber and polymer phase. In this instance, the differences in tan δ result from variations in the quantity and type of rubber impact modifier. Figure 20: DMA trace of HIPS. The good impact performance results from the compatibility of the rubber and styrene phase, showing as one ß transition instead of two in the compound with poor impact properties. Bond strength, Tack and peel, Toughness and flexibility of adhesives Adhesive application characteristics and performance behavior are governed by rheological properties. Making a bond involves a low rate deformation typically around 1 1/s. Bond strength, a major performance criterion is tested by performing a peel or tack test. Tack and peel resistance need to be balanced correctly to make an ideal adhesive. All bonding and debonding processes can be related to the viscoelastic behavior of an adhesive. Poor adhesives are found as shown in Figure 21 for the modulus as a function of rate, to have either too much elasticity at high rates (for peel) or too little at low rates (for tack). This causes a poor adhesive to either rip the substrate when peeling or to stick inadequately. Hot melts need to be tough and flexible at use temperature for most applications. Book binding compounds must not become brittle over the expected use temperature range. Figure 22 shows the dynamic modulus and the loss behavior for a typical hot melt (block copolymer). The differences in storage modulus indicate a significant performance difference at use temperature. The level of the loss modulus can be related to the flexibility of the adhesive. Toughness can be correlated quantitatively to the transition represented by tan δ. Figure 22: Flexibility correlates with the loss modulus, toughness relates to the tan δ peaks9 Viscosity stability at processing temperatures is another important parameter for hot melt adhesives. Resins are frequently kept for hours in open tanks in dispersing equipment. The viscosity versus time, as shown in Figure 23 for a polyamide-based resin, characterizes open time. The bad sample after initial drop due to absorption of water builds up viscosity due to oxidative crosslinking and thus is not suitable when long open times are required. Figure 23: Pot Life of two hot melts. The bad batch shows a viscosity build up as a result of oxidative crosslinking after 15 minutes Revised By A. Franck Figure 21: Tack and peel performance represented by the storage modulus as a function of frequency 6 For more information or to place an order, go to http://www.tainstruments.com/ to locate your local sales office information. Rong, S.D.; William, H.L. “Dynamic Mechanical Measurements of Monofilaments”, University Toronto Press (1985) Knox, J.R. “Dynamic Mechnical Analysis” chap 4 of Thermal Analysis of Polymers, University of Illinois Press (1987) 8 Nielsen, L.E. “Mechanical Properties of Polymers and Composites”, Vol.1, Maecel Dekker, New York 1974 9 Bamborough, D.; Dunckley, P. Adhesives Age, November 1990 7 8 AAN013
