ACTA ELECTROTEHNICA
122
Inrush Current of a Group of
Transformers – Effect of the Secondary
Load
Răzvan Radu, Dan D. Micu, Dan Ovidiu Micu, Andrei Ceclan
Technical University, dept. of Electrical Engineering and Measurements, Cluj-Napoca, Romania
Abstract—Occurrence of inrush transients, which are mostly comprised of the 3rd and 5th harmonic is influenced by a variety of
factors such as the switching angle, the remanent flux of the transformers’ cores but also the load on the secondary side.
Keywords— inrush; transient; load; impedance.
1.
INTRODUCTION
Modern energy distribution grids are moving
ahead towards smart grid control and smart metering.
But there is a constant need for having adequate
protection systems in order to avoid or limit power
outages to a minimum. One important disturbance
which affects protective relays is the occurrence of
inrush currents when reconnecting a group of
transformers, which is the typical event following the
elimination of a faulty section of the grid. As part of our
study which targets using inrush as the key to optimize
the operation of protective relays, we constructed an
analytical model of the main electrical elements needed
to be taken into account for the simulation of inrush
transients [1]. One important detail to take into account
is the type and ratio of the load of each transformer.
Hence, this paper shows how the peak inrush and its
decay rate are affected by the load ratio and its power
factor.
2.
ANALYTICAL MODEL
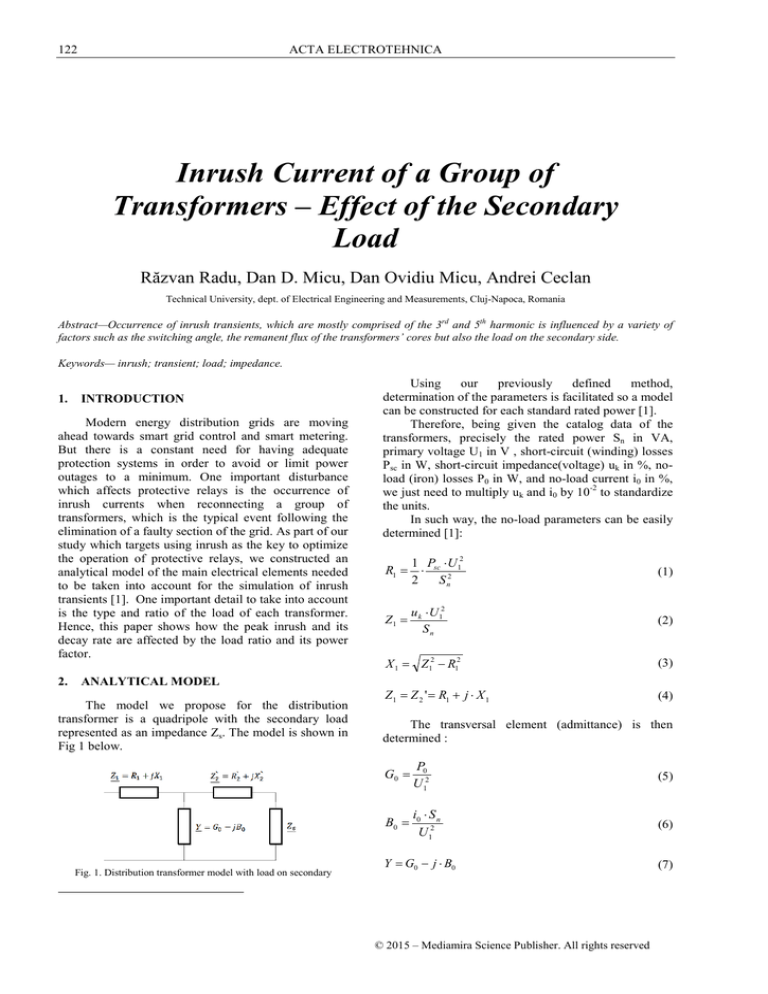
The model we propose for the distribution
transformer is a quadripole with the secondary load
represented as an impedance Zs. The model is shown in
Fig 1 below.
Fig. 1. Distribution transformer model with load on secondary
Using
our
previously
defined
method,
determination of the parameters is facilitated so a model
can be constructed for each standard rated power [1].
Therefore, being given the catalog data of the
transformers, precisely the rated power Sn in VA,
primary voltage U1 in V , short-circuit (winding) losses
Psc in W, short-circuit impedance(voltage) uk in %, noload (iron) losses P0 in W, and no-load current i0 in %,
we just need to multiply uk and i0 by 10-2 to standardize
the units.
In such way, the no-load parameters can be easily
determined [1]:
R1 =
1 Psc ⋅ U 12
⋅
2
S n2
(1)
Z1 =
u k ⋅ U 12
Sn
(2)
X 1 = Z12 − R12
(3)
Z1 = Z 2 ' = R1 + j ⋅ X 1
(4)
The transversal element (admittance) is then
determined :
G0 =
P0
U 12
(5)
B0 =
i0 ⋅ S n
U 12
(6)
Y = G0 − j ⋅ B0
© 2015 – Mediamira Science Publisher. All rights reserved
(7)
Volume 56, Number 1-2, 2015
Next, the remaining element is the load
impedance. In order to obtain the correct values, given
that the transformers are operating live and there is no
possibility to actually measure the on-site impedance of
the load, the simplest method is to determine the
secondary current at full-load[2].
Next, the full-load value can be downscaled and
facilitates calculation of the equivalent impedance by
applying Ohm’s law. The values can then be
recalculated for different power factors by determining
the resistance and reactance which comprise the load
impedance.
I 2n
Sn
=
3 *U 2n
(8)
With U2n being the rated line voltage on the
secondary side, which in our case is 400V.
Then, the impedance is obtained at various points
by simply dividing the rated phase voltage by I2n*load
ratio (0…1). This impedance has to be reported on the
primary side, achieved by amplifying the obtained
value with the transformer ratio[3].
Z s' =
U 2n
k _ load * I 2 n
123
This model is based on validated parameters, so
the components of the quadripole are easily determined
as :
Rcable = 0,188 ⋅ lc
Lcable = 0,186 *10 −3 ⋅ lc
(13)
−6
Ccable = 0,65 *10 ⋅ lc ,
Where lc is the cable length given in kilometers.
1
⋅ (Rcable + j ⋅ ω ⋅ Lcable )
2
Y = j ⋅ ω ⋅ Ccable
Z1 = Z 2 ' =
3.
(14)
NUMERICAL SIMULATIONS AND
RESULTS
The model is based on step-by-step simplification
of the string of transformers and cables, usually
interconnected as shown in Fig.3.
(9)
Z s = Z s' * K 2
(10)
Fig. 3 General topology of a medium voltage feeder upon
reconnection
Given the power factor of the load, we can fully
characterize the transformer by knowing the active and
reactive power consumption through the two
components of the load impedance, the resistance and
inductive reactance.
After modeling each element, the schematic is
then reduced to an ideal voltage source, a switch to be
closed at a given moment, and an equivalent impedance
of the entire feeder, given as:
Rs = Z s * PF
(11)
Z e = Re + j ⋅ X e
(12)
From here, the permanent regime current is
determined as:
X s = ω * Ls = Z s − Rs
2
2
In fact, various models can be constructed and
through series and paralleling of impedances, each
transformer can be simplified to a single equivalent
impedance Ze [4],[5].
The model of the underground cable is also a
quadripole requiring per-unit length parameters [1].
I perm =
U f ⋅ Re
Re + X e
2
2
+
U f ⋅ Xe
Re + X e
2
2
(16)
And knowing that the equivalent inductance is
given by Le=Xe/ω, with ω=2*π*f, we can determine the
time constant of the circuit as:
τ=
Fig. 2 The quadripole model of the underground cable
(15)
Le
Re
(17)
Hence, the inrush regime consists mainly of 3
stages: the peak inrush from the switching to 20*τ , the
transition from the transient from 20*τ to 30*τ, and the
slow decay to the permanent regime load after a
duration of 30*τ.
In this case, the inrush of a group of transformers
can be described by:
ACTA ELECTROTEHNICA
124
i (τ ) = 4 ⋅ i p 0 ⋅ e
−
1
25τ
+ 3 ⋅ i p0 ⋅ e
i (τ ) = i perm (τ ) + 4 ⋅ i p 0 ⋅ e
−
1
125τ
−
1
75τ
, τ < 20 ⋅ τ
, τ > 20 ⋅ τ
(18)
(19)
Where, with γ the phase,
i p0 =
Uf ⋅ 2
Re + X e
2
2
X
⋅ sin γ + arcτan e , τ > 20 ⋅ τ
Re
(20)
Based on this model, on-site samples of the inrush
transient were collected for a case concerning of the
reconnection of 7 distribution transformers (total rated
power is 2960 kVA), assuming a 50% load degree on
each transformer at neutral power factor. The data were
analyzed and extrapolated to a range of load ratios in
order to demonstrate the effects the load over the inrush
transient.
The results are purposed to be used for the
overcurrent relays, as described below.
The safe area to set the protective relays is
restricted by the permanent load limit of the
underground cables, which, for the existing cables,
having a cross-section of 3x150mm2 and Aluminium
conductors, is derated to a value of 280 A because of
the insulation aging.
Hence, we define the safe area as the right-hand
side starting from the point where the decaying inrush
transient crosses the 280 A mark.
It is easy to observe that a larger load ratio leads to
an increased peak inrush and shifts the “safe area”
towards 0.65 seconds for the worst case scenario of
reaching 100% load on all transformers, as shown in
Fig. 4.
On the other hand, if we consider that the load
ratio cannot change dramatically, because the power
substations power the same consumers, a more
plausible 10% increase in load would mean the safe
area shifts from 0.225 to 0.325 seconds, thus a 0.1
seconds increase in the required trip delay.
Next, we can easily distinguish the effect of the
load type, through a power factor reduced to 0.8, as in
Fig.5.
In this case, the safe area is shifted from 0.225 to
0.3 seconds, and the corresponding difference of 0.075
seconds shows less impact than the load ratio.
Fig. 5. Numerical aproximation of the inrush transient at 0.8 power
factor, case 1
The second on-site set of data was collected
following the reconnection of a group of 4 transformers
(total rated power 1910 kVA), making an assumption of
90% load ratio.
In this case, increasing from 90% to 100% load
ratio would mean the safe area shifting from 0.23 to
0.28 seconds, thus a 0.05 seconds increase, as shown in
Fig. 6.
An interesting fact is that the power factor has a
bigger impact in this case, altering the safe area to 0.37
seconds (0.14 seconds increase), opposite when
compared to the other case.
Fig. 6. Numerical aproximation of the inrush transient at 0.92 power
factor, case 2
Fig. 7. Numerical aproximation of the inrush transient at 0.8 power
factor, case 2
Fig. 4. Numerical aproximation of the inrush transient at 0.92 power
factor, case 1
After the analysis of the data, the final conclusions
can be drawn out.
Before issuing any conclusions and comments, we
have to detail that, in the absence of instantaneous
measurements on the corresponding transformers, we
were compelled to make some assumptions which may
affect the coefficients of the inrush transient equation.
Volume 56, Number 1-2, 2015
The first assumption made was that the
transformers, for the two depicted cases, operate at
either 50% load or 90% load, value approximated by
existing measurements at different hours, hence
different load profiles in the urban area. Even so, the
method described here and in [1], [6] allows modeling
of any feeder with any combination of usual
transformers.
The second assumption made was that the
corresponding power factor is the neutral 0.92,
considering that the transformers provide electricity to a
residential area.
Having the results at hand, we can conclude that
the biggest requirement is to investigate the actual load
profiles with digital analyzers, given that both
characteristics have different impact on the inrush
transient.
ACKNOWLEDGMENT
This paper is supported by the Human Resources
Development Program POSDRU/159/1.5/S/137516
financed by the European Social Fund and by the
Romanian Government.
REFERENCES
1.
2.
3.
4.
5.
4.
CONCLUSIONS
This paper is a part of our detailed research on
inrush transients in energy distribution grids with the
final target of using transients as disturbance and then
optimize the operation of relays accordingly.
Here we have shown that there is a correlation
(direct dependence) between the load ratio of the
transformers and the magnitude of the inrush transient
generated by the group.
It has also been proven that the biggest impact is
the load ratio itself, with the load type (described by its
power factor) having less impact on the peak inrush and
its damping rate.
125
6.
R. Radu, D. O. Micu, D. D. Micu, A. Ceclan, “Analytical model
for a Medium Voltage distribution grid’s main elements –
transformers and cables”, in press.
F. de Leon and A. Semlyen, “Complete transformer model for
electromagnetic transients,” IEEE Trans. Power Del., vol. 9, no.
1, pp. 231–239, 1994.
D. Micu, V. Topa, “Basic electrotechnics and electrical
circuits”, Technical University of Cluj-Napoca, 1987.
F. de Leon and A. Semlyen, “Efficient calculation of elementary
parameters of transformers,” IEEE Trans. Power Del., vol. 7,
no. 1, pp. 376–383, Jan. 1992.
N. Chiesa, “Doctoral Thesis: Power Transformer Modeling for
Inrush Current Calculation”, Norwegian University for Science
and Technology, 2010.
R. Radu, Dan O. Micu, A. Ceclan, C. Barbulescu, and St.
Kilyeni, “Recent advances on the influence of power
transformers inrush current over the optimization of medium
voltage feeder protection”, Universities Power Engineering
Conference, Dublin, 2013.
Răzvan Radu
Technical University, dept. of Electrical Engineering and
Measurements
Cluj-Napoca, Romania
Razvan.Radu587@gmail.com

