Molecular identification by generating
advertisement
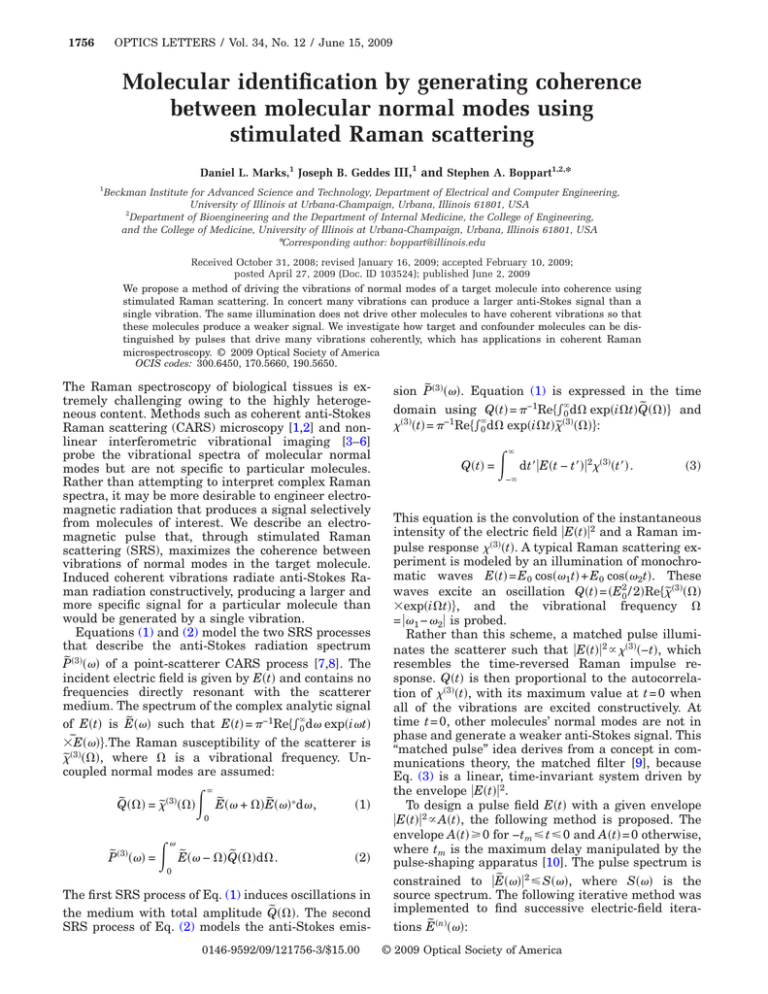
1756 OPTICS LETTERS / Vol. 34, No. 12 / June 15, 2009 Molecular identification by generating coherence between molecular normal modes using stimulated Raman scattering 1 Daniel L. Marks,1 Joseph B. Geddes III, and Stephen A. Boppart1,2,* 1 Beckman Institute for Advanced Science and Technology, Department of Electrical and Computer Engineering, University of Illinois at Urbana-Champaign, Urbana, Illinois 61801, USA 2 Department of Bioengineering and the Department of Internal Medicine, the College of Engineering, and the College of Medicine, University of Illinois at Urbana-Champaign, Urbana, Illinois 61801, USA *Corresponding author: boppart@illinois.edu Received October 31, 2008; revised January 16, 2009; accepted February 10, 2009; posted April 27, 2009 (Doc. ID 103524); published June 2, 2009 We propose a method of driving the vibrations of normal modes of a target molecule into coherence using stimulated Raman scattering. In concert many vibrations can produce a larger anti-Stokes signal than a single vibration. The same illumination does not drive other molecules to have coherent vibrations so that these molecules produce a weaker signal. We investigate how target and confounder molecules can be distinguished by pulses that drive many vibrations coherently, which has applications in coherent Raman microspectroscopy. © 2009 Optical Society of America OCIS codes: 300.6450, 170.5660, 190.5650. The Raman spectroscopy of biological tissues is extremely challenging owing to the highly heterogeneous content. Methods such as coherent anti-Stokes Raman scattering (CARS) microscopy [1,2] and nonlinear interferometric vibrational imaging [3–6] probe the vibrational spectra of molecular normal modes but are not specific to particular molecules. Rather than attempting to interpret complex Raman spectra, it may be more desirable to engineer electromagnetic radiation that produces a signal selectively from molecules of interest. We describe an electromagnetic pulse that, through stimulated Raman scattering (SRS), maximizes the coherence between vibrations of normal modes in the target molecule. Induced coherent vibrations radiate anti-Stokes Raman radiation constructively, producing a larger and more specific signal for a particular molecule than would be generated by a single vibration. Equations (1) and (2) model the two SRS processes that describe the anti-Stokes radiation spectrum P̃共3兲共兲 of a point-scatterer CARS process [7,8]. The incident electric field is given by E共t兲 and contains no frequencies directly resonant with the scatterer medium. The spectrum of the complex analytic signal of E共t兲 is Ẽ共兲 such that E共t兲 = −1Re兵兰0⬁d exp共it兲 ˜ 共兲其.The Raman susceptibility of the scatterer is ⫻E ˜共3兲共⍀兲, where ⍀ is a vibrational frequency. Uncoupled normal modes are assumed: Q̃共⍀兲 = ˜共3兲共⍀兲 冕 ⬁ Ẽ共 + ⍀兲Ẽ共兲*d , 共1兲 0 P̃共3兲共兲 = 冕 Ẽ共 − ⍀兲Q̃共⍀兲d⍀. 共2兲 0 The first SRS process of Eq. (1) induces oscillations in the medium with total amplitude Q̃共⍀兲. The second SRS process of Eq. (2) models the anti-Stokes emis0146-9592/09/121756-3/$15.00 sion P̃共3兲共兲. Equation (1) is expressed in the time domain using Q共t兲 = −1Re兵兰0⬁d⍀ exp共i⍀t兲Q̃共⍀兲其 and 共3兲共t兲 = −1Re兵兰0⬁d⍀ exp共i⍀t兲˜共3兲共⍀兲其: Q共t兲 = 冕 ⬁ dt⬘兩E共t − t⬘兲兩2共3兲共t⬘兲. 共3兲 −⬁ This equation is the convolution of the instantaneous intensity of the electric field 兩E共t兲兩2 and a Raman impulse response 共3兲共t兲. A typical Raman scattering experiment is modeled by an illumination of monochromatic waves E共t兲 = E0 cos共1t兲 + E0 cos共2t兲. These waves excite an oscillation Q共t兲 = 共E02 / 2兲Re兵˜共3兲共⍀兲 ⫻exp共i⍀t兲其, and the vibrational frequency ⍀ = 兩1 − 2兩 is probed. Rather than this scheme, a matched pulse illuminates the scatterer such that 兩E共t兲兩2 ⬀ 共3兲共−t兲, which resembles the time-reversed Raman impulse response. Q共t兲 is then proportional to the autocorrelation of 共3兲共t兲, with its maximum value at t = 0 when all of the vibrations are excited constructively. At time t = 0, other molecules’ normal modes are not in phase and generate a weaker anti-Stokes signal. This “matched pulse” idea derives from a concept in communications theory, the matched filter [9], because Eq. (3) is a linear, time-invariant system driven by the envelope 兩E共t兲兩2. To design a pulse field E共t兲 with a given envelope 兩E共t兲兩2 ⬀ A共t兲, the following method is proposed. The envelope A共t兲 艌 0 for −tm 艋 t 艋 0 and A共t兲 = 0 otherwise, where tm is the maximum delay manipulated by the pulse-shaping apparatus [10]. The pulse spectrum is constrained to 兩Ẽ共兲兩2 艋 S共兲, where S共兲 is the source spectrum. The following iterative method was implemented to find successive electric-field iterations Ẽ共n兲共兲: © 2009 Optical Society of America June 15, 2009 / Vol. 34, No. 12 / OPTICS LETTERS 1. Start with a random guess for Ẽ共0兲共兲 such that 兩Ẽ共0兲共兲兩 = 冑S共兲 but has a random phase. 2. Transform to the time domain such that E共n兲共t兲 = 共2兲−1兰0⬁d exp共it兲Ẽ共n−1兲共兲. 3. Enforce the time-domain amplitude constraint by computing Ê共n兲共t兲 = 共1 − ␣兲E共n兲共t兲 + ␣冑A共t兲共E共n兲共t兲 / ⬁ ⬁ dt⬘兩E共n兲共t⬘兲兩2 / 兰−⬁ dt⬘兩A共t⬘兲兩 with 0 ⬍ ␣ ⬍ 1 兩E共n兲共t兲兩兲冑兰−⬁ being a relaxation constant to stabilize the iterations. 4. Transform to the frequency domain such that ˆ 共n兲 ⬁ dt exp共−it兲Ê共n兲共t兲. Ẽ 共兲 = 兰−⬁ 5. Enforce the constraint 兩Ẽ共兲兩 ⬍ 冑S共兲 by computˆ ˆ ˆ ing ˜⑀共n兲共兲 = Ẽ共n兲共兲冑S共兲 / 兩Ẽ共n兲共兲兩 for 兩Ẽ共n兲共兲兩 ⬎ 冑S共兲 ˆ and ˜⑀共n兲共兲 = Ẽ共n兲共兲 otherwise. 6. Relax the iteration by setting Ẽ共n兲共兲 = 共1 ˜ 共n兲共兲 for 0 ⬍  ⬍ 1. − 兲Ẽ共n−1兲共兲 + ⑀ 7. Continue at step 2 until insignificant changes to Ẽ共n兲共兲 occur between iterations. The fast Fourier transform implements the Fourier integrals on discrete spectra. The choice of ␣ = 0.4 and  = 0.2 appears to ensure reliable convergence. In practice 兩E共t兲兩2 is nonnegative, while 共3兲共t兲 may be negative. A nonnegative approximation A共t兲 for 共3兲共t兲 is made that efficiently utilizes the source spectrum: ␥2 t+w/2 dt⬘兩共3兲共t⬘兲兩2 , 共4兲 W共t兲 = w t−w/2 so that A⬘共t兲 = 共3兲共t兲 + W共t兲, 共5兲 where A共t兲 = A⬘共− t兲 for A⬘共− t兲 ⬎ 0 冑冕 and − tm 艋 t 艋 0, 共6兲 and A共t兲 = 0 otherwise. 共7兲 Positivity of A共t兲 is enforced by adding a positive W共t兲 to 共3兲共t兲, while negative A共t兲 are set to zero. The parameter ␥ trades fidelity of the impulse response with efficiency at exciting the target molecule. This pulse design may not be optimal for maximizing signal from a molecule or for discriminating between molecules, but it accounts for the essential compromises. Figure 1 details a matched-filter Raman spectroscopy instrument. A Raman-active medium generating anti-Stokes radiation is present in one arm of a Mach–Zehnder interferometer. The source produces the bandwidth for both the excitation and reference pulses. The excitation bandwidth is shaped to form a pulse with a spectrum Ẽ共兲. A reference field of spectrum R̃共兲 with bandwidth coinciding with the anti-Stokes radiation is interfered with the antiStokes radiation. A dichroic beam splitter separates the excitation and reference pulses. The Raman medium, with a susceptibility ˜共3兲共⍀兲, oscillates with an anti-Stokes polarization P̃共3兲共兲 as per Eqs. (1) and Pulsed source Low pass dichroic filter Temporal pulse shaper ~ E (ω ) Excitation field Raman scattering medium 1757 ~ P ( 3) (ω ) Anti-Stokes field High pass filter ~ R (ω ) Reference field Temporal delay line + Photo detector - Photo detector Fig. 1. Schematic of a matched-filter Raman imaging instrument that implements the matched-filter Raman spectroscopy method. (2). A high-pass filter separates the medium antiStokes frequencies and the excitation. At the second beam splitter, the reference field and the anti-Stokes field are interfered and detected at two dual-balanced photodetectors. The difference in intensity ⌬I共⌬t兲 captured by the photodetectors given a relative delay ⌬t is 再冕 ⬁ ⌬I共⌬t兲 = 4 Re 0 冎 dR̃共兲P̃共3兲共兲* exp共− i⌬t兲 . 共8兲 The cross correlation between the fields is sampled as the delay ⌬t is scanned. If the reference field R̃共兲 ⬀ P̃共3兲共兲, the interference signal is the autocorrelation of the anti-Stokes field. By shaping the reference field to match the anti-Stokes field, the interference signal at ⌬t = 0 is a matched filter for the emitted anti-Stokes field of a molecule. A simulation was performed including a target molecule and two confounders. The target molecule spectrum consisted of four equal-magnitude Lorentzian lines at 700, 1000, 1250, and 1450 cm−1, each with a 10 cm−1 resonance width. Confounder A (CA) had frequencies of 900, 1100, and 1350 cm−1 each of 10 cm−1 width, with none in common with the target. Confounder B (CB) had frequencies of 800, 1000, and 1450 cm−1 each of 10 cm−1 width, with two in common with the target. CB has more overlap with the target than would be expected between most molecules and therefore is an exceptionally difficult scenario. The source spectrum is Gaussian with a center frequency of 12,500 cm−1 and a FWHM bandwidth of 1800 cm−1. The nonnegative A共t兲 was computed from 共3兲共t兲 using Eqs. (4)–(7), with an averaging window size w = 300 fs, ␥ = 2.0, and tm = 2000 fs. The pulse spectrum Ẽ共兲 was selected by examining 100 pulses generated by the proposed iterative method and selecting the pulse that best rejected CB. The vibrational amplitude Q共t兲 and anti-Stokes signal P̃共3兲共兲 were computed using Eqs. (1) and (2). The antiStokes high-pass filter rejected frequencies less than 14,000 cm−1. The results are in Fig. 2. Figures 2(a) and 2(c) show that the excitation conforms to the source spectrum and the Raman spectrum of the target, with deviation from the target spectrum occurring at low fre- OPTICS LETTERS / Vol. 34, No. 12 / June 15, 2009 (d) -2000 0 2000 Vibration Time (fs) (c) Amplitude (rel units) -2000 -1000 0 Pulse Time Domain (fs) Amplitude (rel units) Amplitude (rel units) 1 1.2 1.4 1.6 4 Source Freq. (cm-1) x 10 (b) (e) 0 Amplitude (rel units) (a) Amplitude (rel units) Amplitude (rel units) 1758 -1500 -1000 -500 0 500 Anti-Stokes Time (fs) 1000 2000 Vibrational Freq. (cm-1) (f) -400 -200 0 200 400 Cross-correlation Time (fs) Fig. 2. Results of a simulation of matched pulse Raman excitation. (a) Spectrum of the shaped pulse. (b) Magnitude in the time domain of the shaped pulse. (c) Magnitude of the Raman spectrum of the molecule [solid black curve (blue online)] and the achieved spectrum (thin black curve) by the iterative method. (d) Amplitude of the induced total vibrational oscillation of each molecule. (e) Amplitude of the anti-Stokes signal from each molecule. (f) Amplitude of the cross correlation of the anti-Stokes signal of each molecule with the target molecule anti-Stokes signal. In (d)–(f), the upper curve (black) is of the target molecule, the lower curve (red online) for confounder A, and the middle curve (blue online) for confounder B. quencies because of the distortion introduced by W共t兲. Figure 2(d), the vibrational amplitude Q共t兲 of the three molecules, shows that at t = 0 the greatest amplitude occurs for the target molecule (thin black curve) as expected. Less polarization is generated for CB and little occurs for CA. Figure 2(e) shows the anti-Stokes signal P共3兲共t兲 scattered by each molecule after the high-pass filter. Because the anti-Stokes power is proportional to molecular concentration squared, the relevant quantity for distinguishing the concentration of a target from a confounder is 冑P / PT, where P and PT are the power emitted by a confounder and the target, respectively, at the same concentration. This ratio 冑P / PT for CA is 0.204 and for CB is 0.622. Finally, Fig. 2(f) is the cross correlation ⌬I共⌬t兲 between the anti-Stokes signal of each molecule and the target molecule. At ⌬t = 0, the crosscorrelation amplitude relative to the target of CA is 0.104 and CB is 0.438, so that interferometry rejects the confounders better than power measurements, because interferometry utilizes the temporal shape of the anti-Stokes signal. To assess performance, we compare the relative amplitudes of the anti-Stokes cross correlations to the cross correlations of the Raman susceptibilities given by ⬁ 兰−⬁ dtC共t兲T共t兲 = , 共9兲 ⬁ 兰−⬁ dtT2 共t兲 冏 冏 where C共t兲 and T共t兲 are the Raman impulses of a confounder and the target, respectively. The ratio characterizes how a linear matched filter separates two signals and is a reasonable estimate of the potential performance of a matched pulse. For CA, A = 0.041, and for CB, B = 0.511. Because we chose a pulse to reject CB, the matched-pulse selectivity 0.438 is slightly better than the B estimate. Matched-pulse Raman spectroscopy is a way to identify molecules by driving the motions of normal modes into coherence, the dynamics of which are largely unexploited by conventional Raman scattering techniques. For this reason, nonlinear spectroscopy and microscopy are likely to be enhanced by exploiting coherences between molecular vibrations. We acknowledge the scientific contributions and advice from Zhi Jiang, Wladimir Benalcazar, and Martin Gruebele from the University of Illinois at Urbana-Champaign. This research was supported in part by the National Institutes of Health (NIH) National Cancer Institute R21CA115536 and National Institute of Biomedical Imaging and Bioengineering R01EB005221, the National Science Foundation (NSF) Chemical, Bioengineering, Environment, and Transport Systems Division 0619257, and the Beckman Institute for Advanced Science and Technology. References 1. M. D. Duncan, J. Reintjes, and T. J. Manuccia, Opt. Lett. 7, 350 (1982). 2. J.-X. Cheng, A. Volkmer, and X. S. Xie, J. Opt. Soc. Am. B 19, 1363 (2002). 3. D. L. Marks and S. A. Boppart, Phys. Rev. Lett. 92, 123905 (2004). 4. G. W. Jones, D. L. Marks, C. Vinegoni, and S. A. Boppart, Opt. Lett. 31, 1543 (2006). 5. D. L. Marks, C. Vinegoni, J. S. Bredfeldt, and S. A. Boppart, Appl. Phys. Lett. 85, 5787 (2004). 6. J. S. Bredfeldt, C. Vinegoni, D. L. Marks, and S. A. Boppart, Opt. Lett. 30, 495 (2005). 7. D. Oron, N. Dudovich, D. Yelin, and Y. Silberberg, Phys. Rev. Lett. 88, 063004 (2002). 8. D. Oron, N. Dudovich, D. Yelin, and Y. Silberberg, Phys. Rev. A 65, 043408 (2002). 9. R. E. Blahut, Theory of Remote Image Formation (Cambridge U. Press, 2004). 10. A. M. Weiner, Rev. Sci. Instrum. 71, 1929 (2000).
