Hi h R l ti LC MS f Q lit ti d Q tit ti M t i High Resolution LC
advertisement
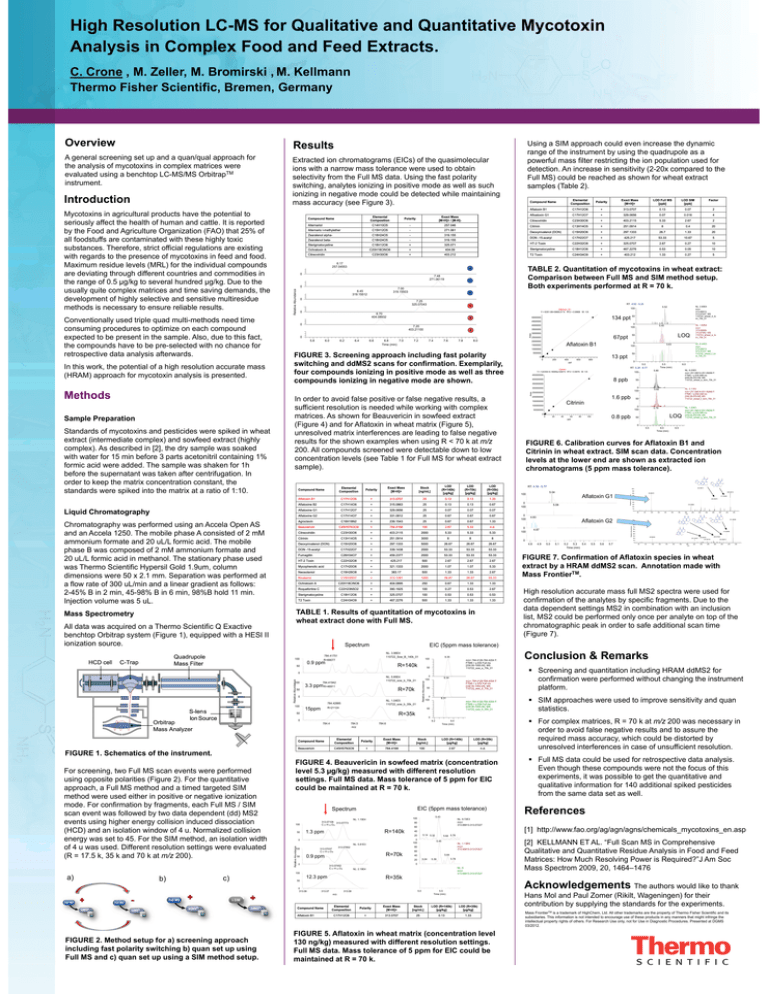
Hi h R High Resolution l ti LC-MS LC MS ffor Qualitative Q lit ti and dQ Quantitative tit ti Mycotoxin M t i Analysis Feed Extracts A ly i in i Complex C pl Food F d and dF d Extracts. E t t C C C. Crone , M. M Zeller, Z ll M. M B Bromirski i ki , M. M K Kellmann ll Thermo Fisher Scientific Scientific, Bremen Bremen, Germany Overview Results A general screening set up and a quan/qual approach for the were th analysis l i off mycotoxins t i iin complex l matrices ti evaluated using g a benchtop p LC-MS/MS Orbitrap pTM instrument. Extracted E d iion chromatograms h (EICs) (EIC ) off the h quasimolecular i l l ions with a narrow mass tolerance were used to obtain selectivity from the Full MS data data. Using the fast polarity switching, switching analytes ionizing in positive mode as well as such i i i in i negative ti mode d could ld be b d t t d while hil maintaining i t i i ionizing detected mass accuracy y ((see Figure g 3). ) Conventionally used triple quad multi-methods multi methods need time consuming procedures to optimize on each compound expected t d tto b be presentt iin the th sample. l Also, Al d due to t this thi fact, f t the compounds p have to be pre-selected p with no chance for retrospective data analysis afterwards. In this work,, the p potential of a high g resolution accurate mass (HRAM) approach for mycotoxin analysis is presented. presented Polarity Exact Mass [[M+H]+ ] LOD Full MS [ppb]] [pp LOD SIM [ppb]] [pp Factor Aflatoxin B1 C17H12O6 + 313.0707 0.13 0.07 2 Afloatoxin G1 C17H12O7 + 329.0656 0.07 0.016 4 Citreoviridin C23H30O6 + 403.2115 5.33 2.67 2 Cit i i Citrinin C13H14O5 + 251 0914 251.0914 8 04 0.4 20 Deoxynivalenol (DON) C15H20O6 + 297 1333 297.1333 26 7 26.7 1 33 1.33 20 DON -15-acetyl C17H22O7 + 425.217 53.33 10.67 5 HT-2 Toxin C22H32O8 + 325.0707 2.67 0.27 10 Elemental Composition Polarity Exact Mass [M+H]+ / [M-H]- Alternariol C14H10O5 - 257 046 257.046 Alternario l-methylether C15H12O5 - 271.061 Zearalenol alpha- C18H24O5 - 319.155 Z Zearalenol l l betab t C18H24O5 - 319 155 319.155 Sterigmatocystine g y C18H12O6 + 325.071 Ochratoxin A C20H18ClNO6 + 404.09 Sterigmatocystine C18H12O6 + 467.2276 0.53 0.05 10 Citreoviridin C23H30O6 + 403.212 T2 Toxin C24H34O9 + 403.212 1.33 0.27 5 Compound Name 6.17 257.04553 257 04553 - 0 7.48 271.06119 0 - 7.00 319.15503 6.45 319 15512 319.15512 0 7 25 7.25 325.07043 0 TABLE 2. 2 Q Quantitation tit ti off mycotoxins t i in i wheat h t extract: t t p p Comparison between Full MS and SIM method setup. Both experiments performed at R = 70 k. RT: 4.82 - 6.29 + 6.70 6 0 404.08932 + 0 4500000 + 6.0 6.2 6.4 6.6 6.8 7.0 Time (min) 0 100 3500000 0 5.8 134 ppt 50 5000000 4000000 7.20 403.21100 403 21100 7.2 7.4 7.6 7.8 8.0 3000000 2000000 Aflatoxin B1 1500000 FIGURE 3. 3 Screening approach including fast polarity switching and ddMS2 scans for confirmation. confirmation Exemplarily Exemplarily, f d iionizing i i iin positive iti mode d as well ll as th four compounds three p g in negative g compounds ionizing mode are shown. 500000 0 200 400 ppt 600 50 13 ppt 0 800 0 5.0 RT: 5.26 - 6.77 Citrinin Y = 124354+4.18085e+006*X R^2 = 0.9979 W: 1/X 100 5.80 NL: 9 NL 9.23E5 23E5 m/z= 251.09014-251.09266 F: FTMS + p ESI SIM ms [249.09-253.09] MS 110722_wheat_e_tsim_70k_01 8 ppb 400000000 5.82 NL: 2.11E5 m/z= 251.09014-251.09266 F: FTMS + p ESI SIM ms [249.09-253.09] [249.09 253.09] MS 110722_wheat_f_tsim_70k_01 5.79 NL: 1.20E5 m/z= 251 251.09014-251.09266 09014-251 09266 F: FTMS + p ESI SIM ms [249.09-253.09] MS 110722 wheat g tsim 70k 01 110722_wheat_g_tsim_70k_01 50 350000000 0 100 Area 250000000 1 6 ppb 1.6 200000000 Citrinin 150000000 100000000 50 0 100 50000000 0 0 20 40 60 ppb 80 0.8 0 8 ppb 100 LOQ 50 0 5.5 6.0 Time (min) 6.5 FIGURE 6. Calibration curves for Aflatoxin B1 and Citrinin in wheat extract extract. SIM scan data. data Concentration levels the llower end as extracted l l att th d are shown h t t d ion i chromatograms g (5 ( pp ppm mass tolerance). ) O O O O O Elemental Composition p Compound Name Chromatography was performed using an Accela Open AS and an Accela 1250. 1250 The mobile phase A consisted of 2 mM ammonium formate and 20 uL/L formic acid. acid The mobile phase h B was composed d off 2 mM M ammonium i f formate and d 20 uL/L formic acid in methanol. The stationaryy p phase used was Thermo Scientific Hypersil Gold 1.9um, 1 9um column dimensions were 50 x 2 2.1 1 mm mm. Separation was performed at a flow rate fl t off 300 uL/min L/ i and d a lilinear gradient di t as follows: f ll 2-45% B in 2 min,, 45-98% B in 6 min,, 98%B hold 11 min. uL Injection volume was 5 uL. Exact Mass [[M+H]+ ] Polarity C17H12O6 + C17H14O6 Stock [[ng/mL] g ] 313 0707 313.0707 + LOD (R=140k) [ g/kg] [µg/kg] 25 315.0863 LOD (R=70k) [ g/kg] [µg/kg] 0 13 0.13 25 LOD (R=35k) [ g/kg] [µg/kg] 0 13 0.13 0.13 0.13 0.67 C17H12O7 + 329.0656 25 0.07 0.07 0.07 Aflatoxine G2 C17H14O7 + 331.0812 25 0.67 0.67 0.67 Agroclavin C16H18N2 + 239.1543 25 0.67 0.67 1.33 Beauvericin C45H57N3O9 + 784 4168 784.4168 100 2 67 2.67 5 33 5.33 nd n.d. Citreoviridin C23H30O6 + 403.2115 2000 5.33 5.33 5.33 C13H14O5 + 251.0914 3000 8 8 8 Deoxynivalenol (DON) C15H20O6 + 297.1333 5000 26.67 26.67 26.67 DON -15-acetyl C17H22O7 + 339.1438 2000 53.33 53.33 53.33 F Fumagillin illi C26H34O7 + 459 2377 459.2377 2000 53 33 53.33 53 33 53.33 53 33 53.33 HT-2 Toxin C22H32O8 + 425 217 425.217 500 2 67 2.67 2 67 2.67 2 67 2.67 Mycophenolic y p acid C17H20O6 + 321.1333 2000 1.07 1.07 5.33 Neosolaniol C19H26O8 + 383.17 500 1.33 1.33 2.67 Nivalenol C15H20O7 + 313.1281 1000 26.67 26.67 53.33 Ochratoxin A C20H18ClNO6 + 404.0895 250 0.67 1.33 1.33 R Roquefortine f ti C C22H23N5O2 + 390 1925 390.1925 100 0 27 0.27 0 53 0.53 2 67 2.67 Sterigmatocystine C18H12O6 + 325 0707 325.0707 100 0 53 0.53 0 53 0.53 0 53 0.53 T2 Toxin C24H34O9 + 467.2276 500 1.33 1.33 1.33 TABLE 1. Results of quantitation q of mycotoxins y in wheat extract done with Full MS. All data was acquired q on a Thermo Scientific Q Exactive benchtop Orbitrap system (Figure 1), 1) equipped with a HESI II ionization source. source S Spectrum t NL: 3.96E4 110722 Sow B 140k 01 110722_Sow_B_140k_01 0.9 ppm 9 35 9.35 100 R=69077 50 R 140k R=140k m/z= 784.4126-784.4204 F: FTMS + p ESI Full ms [230.00-1000.00] MS 110722_sow_a_70k_01 50 50 0 100 NL: 5.85E4 5 85E4 110722_sow_b_70k_01 784.41942 R=46911 3 3 ppm 3.3 Rela ative Ab bundan nce Rela ative A Abunda ance 0 100 R=70k 0 100 NL: 1.04E5 110722_sow_b_35k_01 110722 sow b 35k 01 784.42885 15ppm R=21124 m/z= 784.4126-784.4204 F: FTMS S + p ESI S Full u ms s [230.00-1000.00] MS 110722_sow_b_70k_01 50 0 100 R=35k 50 9 31 9.31 m/z= 784.4126-784.4204 F: FTMS + p ESI Full ms [230.00-1000.00] MS 110722_sow_b_35k_01 0 0 FIGURE 1. 1 Schematics of the instrument. instrument 9.34 9 34 50 784.4 784.5 m/z 9.2 784.6 9.4 Time (min) ( ) Compound Name Elemental Composition Polarity Exact Mass [M+H]+ Stock [ng/mL] LOD (R=140k) [µg/kg] LOD (R=35k) [µg/kg] Beauvericin C45H57N3O9 + 784.4168 100 2.67 n.d. FIGURE G 4. Beauvericin in sowfeed f matrix (concentration ( e e 5 3 µg/ g) measured easu ed with t d e e t resolution eso ut o level 5.3 µg/kg) different settings. settings Full MS data. data Mass tolerance of 5 ppm for EIC could be maintained at R = 70 k k. EIC (5ppm mass tolerance) S Spectrum t 313.07108 313 07108 313.07773 C 17 H 13 O 6 100 50 60 R=140k Relattive Abundancce 50 100 R=70k R 70k 60 5 64 5.64 40 5.04 NL: 0 m/z= 313.06913-313.07227 R 35k R=35k 313.07 5.0 313.08 m/z Aflatoxin B1 5.78 5.39 NL: 2 2.19E4 19E4 12 3 ppm 12.3 Compound Name NL: 1.13E4 m/z= 313 06913 313 07227 313.06913-313.07227 0 50 O 90 5 04 5.04 0 100 O Aflatoxin G1 5.08 329.06519 3 9 065 9 98.98470 80 70 311.05463 60 283.05975 50 40 30 215.06985 20 10 0 60 0 100 4.83 Aflatoxin G2 80 100 120 140 160 180 110722_Neat_A_70k_01 #1272 RT: 4.87 AV: 1 NL: 3.45E5 F: FTMS + p ESI d Full ms2 331.08@hcd45.00 [50.00-355.00] 4.87 240 O 4.9 5.0 5.1 5.2 5.3 5.4 Time (min) 5.5 5.6 5.7 280 300 O O O O 90 O OH 320 340 O O 331.08096 O O 70 O O 60 O O O O O O 50 313.06995 40 O 30 98.98484 221.04439 10 4.8 260 O O 20 0 220 O 100 80 0 100 200 m/z O 245.08075 257.08145 285.07556 240 280 303.08618 0 60 80 100 120 140 160 180 200 m/z 220 260 300 320 340 FIGURE 7. Confirmation of Aflatoxin species in wheat extract by a HRAM ddMS2 scan. Annotation made with Mass FrontierTM. High resolution accurate mass full MS2 spectra were used for confirmation of the analytes by specific fragments. Due to the data dependent settings MS2 in combination with an inclusion list MS2 could be performed only once per analyte on top of the list, chromatographic h t hi peakk in i order d to t safe f additional dditi l scan time ti ((Figure g 7). ) Conclusion & Remarks Screening and quantitation including HRAM ddMS2 for confirmation fi ti were performed f d without ith t changing h i the th instrument i t t platform. SIM approaches h were used d to t improve i sensitivity iti it and d quan statistics. / 200 was necessary in For complex matrices, R = 70 k at m/z order o de to a avoid o d false a se negative egat e results esu ts and a d to assure assu e the t e required mass accuracy accuracy, which could be distorted by unresolved interferences in case of unsufficient resolution. resolution Full MS data could be used for retrospective data analysis. analysis E Even th though h these th compounds d were nott the th focus f off this thi experiments, p it was p possible to get g the q quantitative and qualitative information for 140 additional spiked pesticides from the same data set as well. well R f References [1] htt http://www.fao.org/ag/agn/agns/chemicals_mycotoxins_en.asp // f / / / / h i l t i 5 78 5.64 5.78 5.45 5 45 20 313.07452 C 17 H 13 O 6 0 313.06 5 14 5.32 5.14 5 32 20 80 313.07852 0 9 ppm 0.9 0 40 0 100 NL: 5.81E3 313 07037 313.07037 C 17 H 13 O 6 NL: 9.72E3 m/z= 313.06913-313.07227 80 0 100 5.43 100 NL: 1.15E4 1.3 ppm 100 100 O O 243.06511 EIC (5 (5ppm mass ttolerance) l ) 784.41751 100 O 110722_ Neat_A _70k_01 #1333 RT: 5.06 AV: 1 NL: 2.83E5 F: FTMS + p ESI d Full ms2 329.23@hcd45.00 [50.00-355.00] RT 4.76 4 76 - 5.77 5 77 RT: 1 33 1.33 Aflatoxine G1 Citrinin Mass Spectrometry FIGURE 2. 2 Method M h d setup ffor a)) screening i approach h including g fast p polarity y switching g b)) q quan set up p using g Full MS and c) quan set up using a SIM method setup. setup 6.0 O Liquid Chromatography c)) 5.5 Time (min) 450000000 IIn order d tto avoid id ffalse l positive iti or false f l negative ti results, lt a sufficient resolution is needed while working g with complex p matrices. matrices As shown for Beauvericin in sowfeed extract (Figure 4) and for Aflatoxin in wheat matrix (Figure 5) 5), unresolved l d matrix t i interferences i t f are leading l di to t false f l negative ti results for the shown examples p when using g R < 70 k at m/z 200. All compounds screened were detectable down to low concentration levels (see Table 1 for Full MS for wheat extract sample). l ) Aflatoxine B2 b) NL: 6.44E3 m/z= 313 06913 313.06913313.07227 MS 110722_wheat_f_tsi m 70k 01 m_70k_01 5.63 1000000 Aflatoxin B1 For screening, g, two Full MS scan events were p performed using opposite polarities (Figure 2). 2) For the quantitative approach a Full MS method and a timed targeted SIM approach, method th d were used d either ith in i positive iti or negative ti ionization i i ti mode. For confirmation byy fragments, g , each Full MS / SIM scan event was followed by two data dependent (dd) MS2 events using higher energy collision induced dissociation (HCD) and off 4 u. Normalized d an isolation i l ti window i d N li d collision lli i gy was set to 45. For the SIM method,, an isolation width energy of 4 u was used. used Different resolution settings were evaluated (R = 17.5 17 5 kk, 35 k and 70 k at m/z 200). 200) LOQ 0 100 Relative Ab bundance Standards of mycotoxins and pesticides were spiked in wheat extract t t (intermediate (i t di t complex) l ) and d sowfeed f d extract t t (highly (hi hl complex). p ) As described in [2], [ ] the dryy sample p was soaked with water for 15 min before 3 parts acetonitril containing 1% formic acid were added. added The sample was shaken for 1h b f before th supernatant the t t was taken t k after ft centrifugation. t if ti I In order to keep p the matrix concentration constant, the standards were spiked into the matrix at a ratio of 1:10. NL: 1.60E4 m/z= m/z 313.06939313.07252 MS 110722 wheat e ts 110722_wheat_e_ts im_70k_01 5.45 50 67ppt 67 t 2500000 Relativve Abundancce Sample Preparation NL: 2.65E4 m/z= 313.06913313.07227 MS 110722_wheat_d_ts im_70k_01 5.52 100 Aflatoxin_B1 Y = 6351.99+5868.01*X R^2 = 0.9968 W: 1/X 300000000 Methods a)) Elemental Composition p Compound Name Are ea Mycotoxins M t i in i agricultural i lt l products d t have h the th potential t ti l to t seriouslyy affect the health of human and cattle. It is reported p by the Food and Agriculture Organization (FAO) that 25% of all foodstuffs are contaminated with these highly toxic substances. b t Therefore, Th f strict t i t official ffi i l regulations l ti are existing i ti g p y with regards to the presence of mycotoxins in feed and food. Maximum residue levels (MRL) for the individual compounds are deviating through different countries and commodities in the range of 0 0.5 5 µg/kg to several hundred µg/kg. µg/kg Due to the usually quite complex matrices and time saving demands, the development of highly selective and sensitive multiresidue results methods is necessary to ensure reliable results. R Relati ive Ab bunda ance Introduction Using a SIM approach could even increase the dynamic range off the th instrument i t t by b using i the th quadrupole d l as a powerful mass filter restricting p g the ion population p p used for detection. An increase in sensitivity (2-20x (2 20x compared to the Full MS) could be reached as shown for wheat extract samples (Table 2). 2) [2] KELLMANN ET AL AL. “Full Full Scan MS in Comprehensive Q lit ti and dQ tit ti R id Analysis A l i in i Food F d and d Feed F d Qualitative Quantitative Residue Matrices: How Much Resolving g Power is Required?”J q Am Soc Mass Spectrom 2009, 2009 20, 20 1464–1476 1464 1476 A k Acknowledgements l dg t The authors would like to thank 5.5 Time (min) Elemental Composition Polarity Exact Mass [M+H]+ Stock [ng/mL] LOD (R=140k) [µg/kg] LOD (R=35k) [µg/kg] C17H12O6 + 313.0707 25 0.13 1.33 FIGURE 5. Aflatoxin in wheat matrix (concentration level 130 ng/kg) measured with different resolution settings. Full MS data. data Mass tolerance of 5 ppm for EIC could be maintained at R = 70 k. k Hans Mol and Paul Zomer (Rikilt, (Rikilt Wageningen) for their contribution by supplying the standards for the experiments. experiments Mass FrontierTM is a trademark of HighChem, Ltd. All other trademarks are the property of Thermo Fisher Scientific and its subsidiaries This information is not intended to encourage use of these products in any manners that might infringe the subsidiaries. intellectual property rights of others. For Research Use only, not for Use in Diagnostic Procedures. Presented at DGMS 03/2012.
