Frequency dispersion in III-V metal-oxide
advertisement
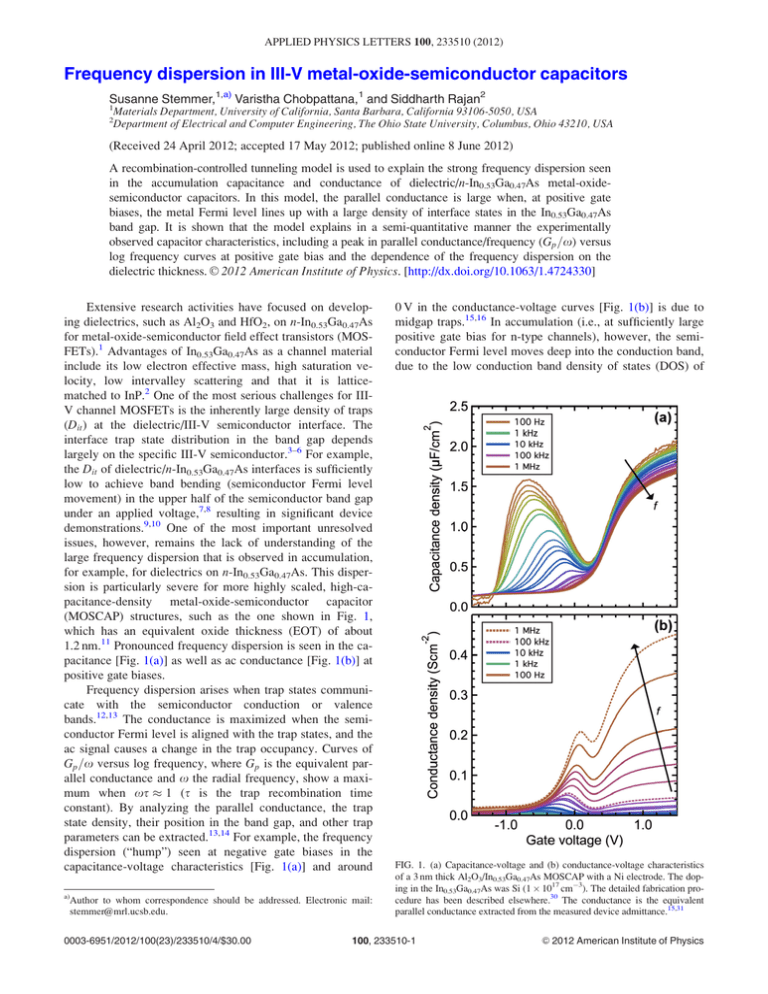
APPLIED PHYSICS LETTERS 100, 233510 (2012) Frequency dispersion in III-V metal-oxide-semiconductor capacitors Susanne Stemmer,1,a) Varistha Chobpattana,1 and Siddharth Rajan2 1 Materials Department, University of California, Santa Barbara, California 93106-5050, USA Department of Electrical and Computer Engineering, The Ohio State University, Columbus, Ohio 43210, USA 2 (Received 24 April 2012; accepted 17 May 2012; published online 8 June 2012) A recombination-controlled tunneling model is used to explain the strong frequency dispersion seen in the accumulation capacitance and conductance of dielectric/n-In0.53Ga0.47As metal-oxidesemiconductor capacitors. In this model, the parallel conductance is large when, at positive gate biases, the metal Fermi level lines up with a large density of interface states in the In0.53Ga0.47As band gap. It is shown that the model explains in a semi-quantitative manner the experimentally observed capacitor characteristics, including a peak in parallel conductance/frequency (Gp =x) versus log frequency curves at positive gate bias and the dependence of the frequency dispersion on the C 2012 American Institute of Physics. [http://dx.doi.org/10.1063/1.4724330] dielectric thickness. V Extensive research activities have focused on developing dielectrics, such as Al2O3 and HfO2, on n-In0.53Ga0.47As for metal-oxide-semiconductor field effect transistors (MOSFETs).1 Advantages of In0.53Ga0.47As as a channel material include its low electron effective mass, high saturation velocity, low intervalley scattering and that it is latticematched to InP.2 One of the most serious challenges for IIIV channel MOSFETs is the inherently large density of traps (Dit ) at the dielectric/III-V semiconductor interface. The interface trap state distribution in the band gap depends largely on the specific III-V semiconductor.3–6 For example, the Dit of dielectric/n-In0.53Ga0.47As interfaces is sufficiently low to achieve band bending (semiconductor Fermi level movement) in the upper half of the semiconductor band gap under an applied voltage,7,8 resulting in significant device demonstrations.9,10 One of the most important unresolved issues, however, remains the lack of understanding of the large frequency dispersion that is observed in accumulation, for example, for dielectrics on n-In0.53Ga0.47As. This dispersion is particularly severe for more highly scaled, high-capacitance-density metal-oxide-semiconductor capacitor (MOSCAP) structures, such as the one shown in Fig. 1, which has an equivalent oxide thickness (EOT) of about 1.2 nm.11 Pronounced frequency dispersion is seen in the capacitance [Fig. 1(a)] as well as ac conductance [Fig. 1(b)] at positive gate biases. Frequency dispersion arises when trap states communicate with the semiconductor conduction or valence bands.12,13 The conductance is maximized when the semiconductor Fermi level is aligned with the trap states, and the ac signal causes a change in the trap occupancy. Curves of Gp =x versus log frequency, where Gp is the equivalent parallel conductance and x the radial frequency, show a maximum when xs 1 (s is the trap recombination time constant). By analyzing the parallel conductance, the trap state density, their position in the band gap, and other trap parameters can be extracted.13,14 For example, the frequency dispersion (“hump”) seen at negative gate biases in the capacitance-voltage characteristics [Fig. 1(a)] and around a) Author to whom correspondence should be addressed. Electronic mail: stemmer@mrl.ucsb.edu. 0003-6951/2012/100(23)/233510/4/$30.00 0 V in the conductance-voltage curves [Fig. 1(b)] is due to midgap traps.15,16 In accumulation (i.e., at sufficiently large positive gate bias for n-type channels), however, the semiconductor Fermi level moves deep into the conduction band, due to the low conduction band density of states (DOS) of FIG. 1. (a) Capacitance-voltage and (b) conductance-voltage characteristics of a 3 nm thick Al2O3/In0.53Ga0.47As MOSCAP with a Ni electrode. The doping in the In0.53Ga0.47As was Si (1 1017 cm3). The detailed fabrication procedure has been described elsewhere.30 The conductance is the equivalent parallel conductance extracted from the measured device admittance.15,31 100, 233510-1 C 2012 American Institute of Physics V 233510-2 Stemmer, Chobpattana, and Rajan III-V semiconductors.17–19 The recombination time constants of interface states that line up with the semiconductor Fermi level at positive gate bias are expected to be very short and are thus not expected to give rise to a strong frequency dispersion.20 A possible explanation put forward in the recent literature is that the frequency dispersion in accumulation is due to “border traps,” which are defects that reside in the oxide.20–23 Tunneling into these defects is associated with a time constant that depends on their distance to the interface, giving rise to frequency dispersion.13,20 It is reasonable to expect that the type and spatial distribution of border traps, and thus the frequency dispersion characteristics, should depend on the specific dielectric or the dielectric deposition method. Yet, the reported admittance characteristics of wellbehaved dielectric/III-V interfaces with different dielectrics and/or dielectrics deposited by different methods are remarkably similar.5,15,24 The similarity in the observed characteristics of MOSCAPs in the literature is in keeping with a large body of work on III-V Schottky barriers and surfaces that have shown that semiconductor surface Fermi level pinning is largely caused by defects in the III-V semiconductor and not by the specific surface adsorbate or metal.3,4 While these results point to semiconductor defects as the origin, the mechanisms by which they could cause frequency dispersion in accumulation are not understood. In this letter, we discuss a mechanism by which interface traps can give rise to strong frequency dispersion in accumulation for scaled III-V MOSCAPs. We show that this mechanism is consistent with the measured admittance characteristics and with the highdensity and non-uniform trap distribution within the band gap that is typical for many III-V semiconductors. In addition to communicating with the semiconductor bands, interface traps may communicate with the metal via tunneling, provided that the dielectric is thin.25,26 The process by communication with the metal can give rise to a frequency-dependent ac conductance is schematically illustrated in Fig. 2 for positive gate bias and an n-type semiconductor that has a peak in Dit , as indicated. Specifically, for dielectrics on In0.53Ga0.47As, the Dit near midgap becomes very large.5,6,15,24 At sufficient positive gate bias, the metal FIG. 2. Energy-band diagram of an n-channel MOSCAP in accumulation. A peak in the interface trap state density is shown. The arrows indicate a recombination-controlled tunneling process, involving tunneling (horizontal arrow) and electron capture processes. EFm and EFs indicate the metal and semiconductor Fermi levels, respectively. Appl. Phys. Lett. 100, 233510 (2012) Fermi level will thus align with the high density of traps and electrons can tunnel from the traps to the metal. The ac signal causes the metal Fermi level (EFm) to oscillate through Et (trap level). A conducting channel (ac loss) is provided through recombination of carriers with the interface states, as indicated by the vertical arrow in Fig. 2. When the tunneling time constant is small compared to the surface recombination time,26 the process is known as “recombination-controlled tunneling.” For traps that communicate with the conduction band, the ac conductance at a given applied bias, Va, is given by25 x2 s2 dJ GðVa Þ ¼ ; 1 þ x2 s2 dV (1) Va where J is the tunnel current density. The recombination time constant s is proportional to the inverse of the semiconductor sheet carrier concentration, ns,25,26 s¼ 1 ; rhviðn1 þ ns Þ (2) where r is the trap cross-section, hvi is the thermal velocity of the carriers, and the carrier concentration n1 enters to balance the capture rate equations (see Ref. 26 for the derivation of Eq. (2); in accumulation n1 is small compared to ns). From Eq. (1), it can be seen that the conductance due to recombination-controlled tunneling is zero at dc and increases to dJ=dV as the frequency increases. Qualitatively, the observed conductance characteristics [Fig. 1(b)] agree with this. In addition, the model explains the fact that the dispersion becomes large at large positive biases, when the metal Fermi level faces the region where the Dit is high. For example, the dispersion in the capacitance for well-behaved MOSCAPs is relatively low at small positive bias and then increases with positive bias, as can be seen for example in Fig. 1(a). Given the doping and the flatband voltage (0.4 V for the MOSCAP with 3 nm Al2O3), the metal Fermi level aligns with trap states near midgap at a gate bias around 1 V. Thus, it is likely that the same midgap traps that cause the frequency dependent “hump” in capacitance at negative bias, when these trap states align with the semiconductor Fermi level, are also responsible for the frequency dispersion in accumulation, when they align with the metal Fermi level. This also explains experimental results that show simultaneous reduction in dispersion in accumulation and depletion upon annealing.8,23,27 To determine if the observed frequency dispersion in accumulation can be described quantitatively by the recombination-controlled tunneling mechanism, normalized plots of Gp =x versus log frequency are shown in Figs. 3(a) and 3(b)). Referring again to Eq. (1), these should exhibit a maximum at xs 1. Figures 3(a) and 3(b) show that the Gp =x versus log frequency at different positive gate biases for the MOSCAPs of Figs. 1(a) and 1(b) exhibit maxima. The dashed line in Fig. 3(a) shows that these maxima can be described by a function of form xs2 =ð1 þ x2 s2 Þ, as predicted by Eq. (1). The theoretical function is symmetric, while the experimental curve falls off less rapidly with frequency. For the conventional mechanism of communication 233510-3 Stemmer, Chobpattana, and Rajan FIG. 3. Gp =x versus log frequency curves for (a) 3 nm thick Al2O3/ In0.53Ga0.47As and (b) 5 nm thick Al2O3/In0.53Ga0.47As. The black dotted line in (a) is a plot of the function Cxs2 =ð1 þ x2 s2 Þ, where C is a constant. (c) Plot of extracted s parameters (left axis) as a function of voltage for the 3 nm thick Al2O3/In0.53Ga0.47As sample obtained from fitting the Gp =x plots to Eq. (1). The solid line is an exponential fit to the data. Also shown is the inverse of the estimated semiconductor sheet carrier density (right axis). with the bands, this has been attributed to fluctuations in the surface potential.13 Another possibility is contribution from a series resistance term at high frequencies. For the MOSCAP with the thicker dielectric [Fig. 3(b)], larger positive gate biases are needed to observe the peak, as expected due to the reduced capacitance density of this stack (see discussion of s below). The tunnel conductance extracted using the peaks (see Eq. (1)) is a factor of 14 higher for the 3 nm Al2O3 (at 1.4 V) than for the 5 nm (at 1.8 V). The increase agrees with estimates based on Wentzel, Kramers, and Brillouin (WKB) theory of the thickness dependence of the tunneling current. The fact that a discrete peak is observed in Figs. 3(a) and 3(b) indicates that the conductance experiment probes a discrete trap state, rather than a wide distribution of Appl. Phys. Lett. 100, 233510 (2012) states.25 From fits of the experimental data to Eq. (1), shown in Fig. 3(c), it can be seen that the trap time constant, s, exponentially decreases with applied bias. This agrees with Eq. (2), i.e., s is inversely proportional to the semiconductor surface charge density, ns.13,25 Specifically, the estimated inverse of the charge density, ðns Þ1 for this MOSCAP,17 also shown in Fig. 3(c), and s have a similar dependence on the applied voltage. We note that the standard model for the conductance through communication with the semiconductor bands,13 i.e., in the absence of tunneling, also gives rise to a Gp =x peak, but for the reasons discussed above, no frequency dispersion is expected in accumulation due to this mechanism. Border traps should not result in a Gp =x peak.13 An important consideration is the contribution from frequency-independent band-to-band tunneling to the measured conductance, which dominates for Si MOSCAPs with thin dielectrics.28,29 As can be seen from Fig. 1(b), for the III-V MOSCAP, the largest contribution to the conductance at positive gate biases is strongly frequency dependent. Dielectric/III-V interfaces differ in two important aspects from SiO2/Si interfaces: (i) the Dit of dielectric/III-V interfaces is orders of magnitude higher than for Si MOSCAPs (rising well into 1014 eV1cm2 near the valence band24), allowing for a large tunnel current through these states and (ii) the conduction band DOS of III-V semiconductors such as In0.53Ga0.47As is several orders of magnitude lower than that of Si. As a result, the surface charge density, which determines band-to-band tunneling, remains around 1013 cm2.15 Although there is currently no complete theory describing the tunneling current for extremely high-density of interface states, the large ratio of Dit relative to conduction band DOS will make tunneling through interface states a significant contribution to the total conductance of III-V MOSCAPs. In summary, we have shown that the frequency dispersion in accumulation of typical dielectric/n-In0.53Ga0.47As MOSCAPs, the appearance of a Gp =x peak at positive gate bias, and the thickness dependence of the conductance are consistent with the communication of a high density of interface traps with the metal. The interface trap states that are responsible for the frequency dispersion in accumulation reside in the lower half of the In0.53Ga0.47As band gap, as the metal Fermi level lines up with these states only at positive gate biases. The strong frequency dispersion is thus directly a consequence of the asymmetric (with respect to their position in the band gap) distribution of trap states in semiconductors such as In0.53Ga0.47As. We note that more extreme forms of dispersion are seen in cases of pinned interfaces and thick dielectrics (such as for p-In0.53Ga0.47As, see, i.e., Ref. 15); in such cases, accumulation is not reached and the mechanisms discussed here do not apply. The most important practical consequence of the recombination-controlled tunneling processes is that for n-type channels not only must trap densities in the upper half of the band gap be sufficiently low (to enable efficient semiconductor band bending for MOSFET operation) but, to achieve low frequency dispersion with thin dielectrics, trap states in the lower half of the band gap must also be controlled. For In0.53Ga0.47As, reducing the midgap trap densities has proven to be very challenging. Finally, we note that the communication of the trap 233510-4 Stemmer, Chobpattana, and Rajan states with the metal must also be included in the analysis of interface traps in depletion and weak inversion regions, which will be the subject of future work. We thank Junwoo Son for help with the measurements. S.S. and S.R. acknowledge collaborative research supported by the ONR Define MURI (Grant No. N00014-10-1-0937). V.C. was partially supported by the Semiconductor Research Corporation through the Nonclassical CMOS Research Center (Task ID 1437.008). Additional support for experimental costs was provided by NSF (award number ECCS-1125017). The work made use of the UCSB Nanofabrication Facility, a part of the NSF-funded NNIN network. 1 M. Heyns and W. Tsai, MRS Bull. 34, 485 (2009). M. J. W. Rodwell, U. Singisetti, M. Wistey, G. J. Burek, A. Carter, A. Baraskar, J. Law, B. J. Thibeault, E. J. Kim, B. Shin et al., in 2010 International Conference on Indium Phosphide & Related Materials (IEEE, IPRM) (2010). 3 W. E. Spicer, I. Lindau, P. Skeath, and C. Y. Su, J. Vac. Sci. Technol. 17, 1019 (1980). 4 W. Walukiewicz, Phys. Rev. B 37, 4760 (1988). 5 S. Oktyabrsky, Y. Nishi, S. Koveshnikov, W.-E. Wang, N. Goel, and W. Tsai, in Fundamentals of III-V Semiconductor MOSFETs, edited by S. Oktyabrsky and P. Ye (Springer, New York, 2010). 6 J. Robertson, Appl. Phys. Lett. 94, 152104 (2009). 7 E. J. Kim, E. Chagarov, J. Cagnon, Y. Yuan, A. C. Kummel, P. M. Asbeck, S. Stemmer, K. C. Saraswat, and P. C. McIntyre, J. Appl. Phys. 106, 124508 (2009). 8 Y. Hwang, R. Engel-Herbert, N. G. Rudawski, and S. Stemmer, J. Appl. Phys. 108, 034111 (2010). 9 M. Egard, L. Ohlsson, B. M. Borg, F. Lenrick, R. Wallenberg, L.-E. Wernersson, and E. Lind, in 2011 IEEE International Electron Devices Meeting (IEDM) (IEEE, 2011), p. 13.2.1. 10 M. Radosavljevic, G. Dewey, D. Basu, J. Boardman, B. Chu-Kung, J. M. Fastenau, S. Kabehie, J. Kavalieros, V. Le, W. K. Liu et al., in 2011 IEEE International Electron Devices Meeting (IEDM) (IEEE, 2011), p. 33.1.1. 2 Appl. Phys. Lett. 100, 233510 (2012) 11 See supplemental material at http://dx.doi.org/10.1063/1.4724330 for data showing the thicknesss and temperature dependence of the dispersion in the accumulation capacitance. 12 K. Lehovec and A. Slobodskoy, Solid-State Electron. 7, 59 (1964). 13 E. H. Nicollian and A. Goetzberger, Bell System Tech. J. 46, 1055 (1967). 14 K. Martens, C. O. Chui, G. Brammertz, B. De Jaeger, D. Kuzum, M. Meuris, M. M. Heyns, T. Krishnamohan, K. Saraswat, H. E. Maes et al., IEEE Trans. Electron Devices 55, 547 (2008). 15 R. Engel-Herbert, Y. Hwang, and S. Stemmer, J. Appl. Phys. 108, 124101 (2010). 16 I. Krylov, L. Kornblum, A. Gavrilov, D. Ritter, and M. Eizenberg, Appl. Phys. Lett. 100, 173508 (2012). 17 R. Engel-Herbert, Y. Hwang, and S. Stemmer, Appl. Phys. Lett. 97, 062905 (2010). 18 T. P. O’Regan and P. K. Hurley, Appl. Phys. Lett. 99, 163502 (2011). 19 E. Lind, Y. M. Niquet, H. Mera, and L. E. Wernersson, Appl. Phys. Lett. 96, 233507 (2010). 20 Y. Yuan, L. Q. Wang, B. Yu, B. H. Shin, J. Ahn, P. C. McIntyre, P. M. Asbeck, M. J. W. Rodwell, and Y. Taur, IEEE Electron Device Lett. 32, 485 (2011). 21 G. W. Paterson, M. C. Holland, I. G. Thayne, and A. R. Long, J. Appl. Phys. 111, 074109 (2012). 22 G. Brammertz, A. Alian, D. H. C. Lin, M. Meuris, M. Caymax, and W. E. Wang, IEEE Trans. Electron Devices 58, 3890 (2011). 23 E. J. Kim, L. Q. Wang, P. M. Asbeck, K. C. Saraswat, and P. C. McIntyre, Appl. Phys. Lett. 96, 012906 (2010). 24 G. Brammertz, H. C. Lin, K. Martens, A. Alian, C. Merckling, J. Penaud, D. Kohen, W.-E. Wang, S. Sioncke, A. Delabie et al., ECS Trans. 19(5), 375 (2009). 25 J. Shewchun, A. Waxman, and G. Warfield, Solid-State Electron. 10, 1165 (1967). 26 L. B. Freeman and W. E. Dahlke, Solid-State Electron. 13, 1483 (1970). 27 G. J. Burek, Y. Hwang, A. D. Carter, V. Chobpattana, J. J. M. Law, W. J. Mitchell, B. Thibeault, S. Stemmer, and M. J. W. Rodwell, J. Vac. Sci. Technol. B 29, 040603 (2011). 28 A. Waxman, J. Shewchun, and G. Warfield, Solid-State Electron. 10, 1187 (1967). 29 H. C. Card and E. H. Rhoderick, Solid-State Electron. 15, 993 (1972). 30 A. D. Carter, W. J. Mitchell, B. J. Thibeault, J. J. M. Law, and M. J. W. Rodwell, Appl. Phys. Express 4, 091102 (2011). 31 E. H. Nicollian and J. R. Brews, MOS (Metal Oxide Semiconductor) Physics and Technology (Wiley, New York, 1982). Applied Physics Letters is copyrighted by the American Institute of Physics (AIP). Redistribution of journal material is subject to the AIP online journal license and/or AIP copyright. For more information, see http://ojps.aip.org/aplo/aplcr.jsp
