Electricity Mandate – History of Rate Changes for Domestic
advertisement

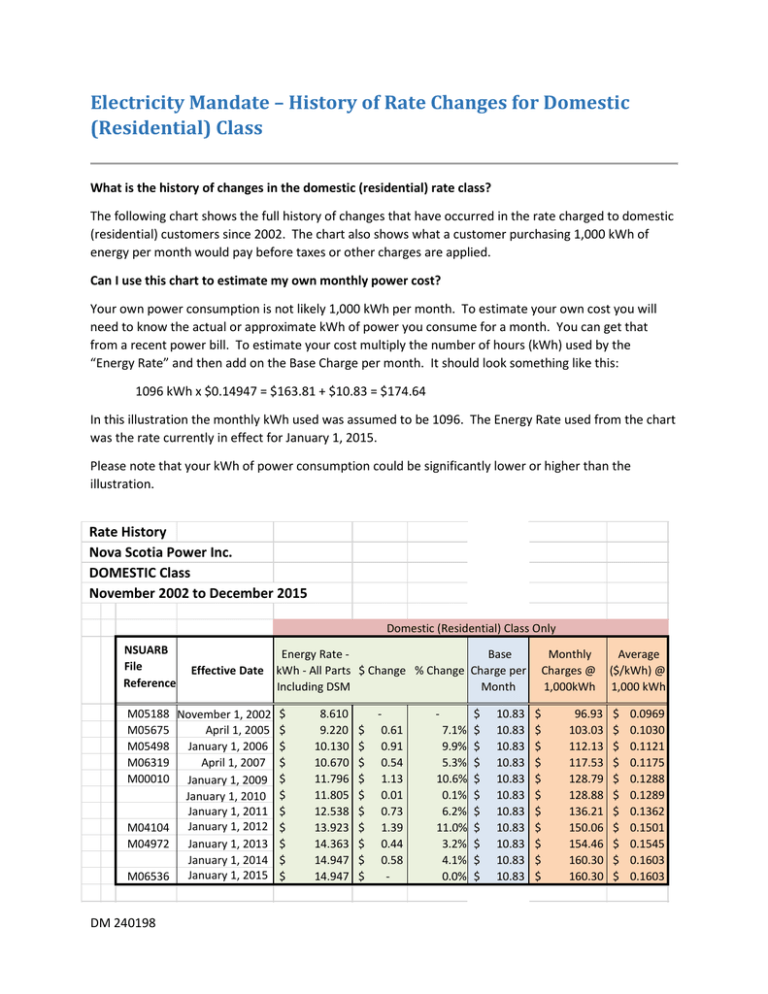
Electricity Mandate – History of Rate Changes for Domestic (Residential) Class What is the history of changes in the domestic (residential) rate class? The following chart shows the full history of changes that have occurred in the rate charged to domestic (residential) customers since 2002. The chart also shows what a customer purchasing 1,000 kWh of energy per month would pay before taxes or other charges are applied. Can I use this chart to estimate my own monthly power cost? Your own power consumption is not likely 1,000 kWh per month. To estimate your own cost you will need to know the actual or approximate kWh of power you consume for a month. You can get that from a recent power bill. To estimate your cost multiply the number of hours (kWh) used by the “Energy Rate” and then add on the Base Charge per month. It should look something like this: 1096 kWh x $0.14947 = $163.81 + $10.83 = $174.64 In this illustration the monthly kWh used was assumed to be 1096. The Energy Rate used from the chart was the rate currently in effect for January 1, 2015. Please note that your kWh of power consumption could be significantly lower or higher than the illustration. Rate History Nova Scotia Power Inc. DOMESTIC Class November 2002 to December 2015 Domestic (Residential) Class Only NSUARB File Reference Energy Rate Base Effective Date kWh - All Parts $ Change % Change Charge per Including DSM Month M05188 November 1, 2002 $ M05675 April 1, 2005 $ M05498 January 1, 2006 $ M06319 April 1, 2007 $ M00010 January 1, 2009 $ January 1, 2010 $ January 1, 2011 $ M04104 January 1, 2012 $ M04972 January 1, 2013 $ January 1, 2014 $ M06536 January 1, 2015 $ DM 240198 8.610 9.220 10.130 10.670 11.796 11.805 12.538 13.923 14.363 14.947 14.947 $ $ $ $ $ $ $ $ $ $ 0.61 0.91 0.54 1.13 0.01 0.73 1.39 0.44 0.58 - 7.1% 9.9% 5.3% 10.6% 0.1% 6.2% 11.0% 3.2% 4.1% 0.0% $ $ $ $ $ $ $ $ $ $ $ 10.83 10.83 10.83 10.83 10.83 10.83 10.83 10.83 10.83 10.83 10.83 Monthly Charges @ 1,000kWh $ $ $ $ $ $ $ $ $ $ $ 96.93 103.03 112.13 117.53 128.79 128.88 136.21 150.06 154.46 160.30 160.30 Average ($/kWh) @ 1,000 kWh $ $ $ $ $ $ $ $ $ $ $ 0.0969 0.1030 0.1121 0.1175 0.1288 0.1289 0.1362 0.1501 0.1545 0.1603 0.1603 Notes: 2 This chart shows the changes from 2002 onward in both parts of a residential or domestic class power rate with an approximation of the total bill, before taxes, assuming 1,000 kWh of power is used in the billing period. Note that the Energy Rate figures INCLUDE the basic energy rate itself, plus/minus FAM and other adjustments, plus any amount payable for demand side management (whether in a separate rider or otherwise included in rates). 3 Note that percentage changes in power rates reported in the media are based on the total "revenue requirement" for the rate class. Percentage changes noted above are more accurate being based on the rates after confirmation in the subsequent Compliance Filing. Figures may vary slightly from media reports. 4 Rates are set to three decimal places. Dollar amounts in the above illustrated monthly charges are rounded to the nearest cent. DM 240198


