Why a milder winter might delay spring leaf-out
advertisement

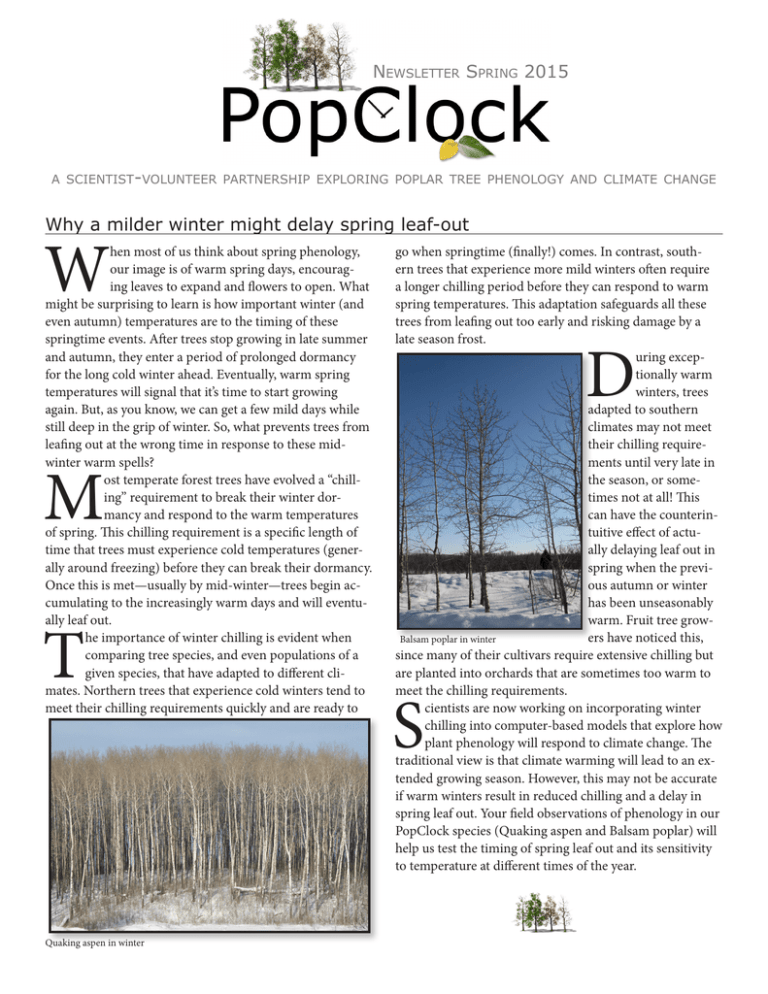
Newsletter Spring 2015 a scientist-volunteer partnership exploring poplar tree phenology and climate change Why a milder winter might delay spring leaf-out W hen most of us think about spring phenology, our image is of warm spring days, encouraging leaves to expand and flowers to open. What might be surprising to learn is how important winter (and even autumn) temperatures are to the timing of these springtime events. After trees stop growing in late summer and autumn, they enter a period of prolonged dormancy for the long cold winter ahead. Eventually, warm spring temperatures will signal that it’s time to start growing again. But, as you know, we can get a few mild days while still deep in the grip of winter. So, what prevents trees from leafing out at the wrong time in response to these midwinter warm spells? ost temperate forest trees have evolved a “chilling” requirement to break their winter dormancy and respond to the warm temperatures of spring. This chilling requirement is a specific length of time that trees must experience cold temperatures (generally around freezing) before they can break their dormancy. Once this is met—usually by mid-winter—trees begin accumulating to the increasingly warm days and will eventually leaf out. he importance of winter chilling is evident when comparing tree species, and even populations of a given species, that have adapted to different climates. Northern trees that experience cold winters tend to meet their chilling requirements quickly and are ready to M T Quaking aspen in winter go when springtime (finally!) comes. In contrast, southern trees that experience more mild winters often require a longer chilling period before they can respond to warm spring temperatures. This adaptation safeguards all these trees from leafing out too early and risking damage by a late season frost. uring exceptionally warm winters, trees adapted to southern climates may not meet their chilling requirements until very late in the season, or sometimes not at all! This can have the counterintuitive effect of actually delaying leaf out in spring when the previous autumn or winter has been unseasonably warm. Fruit tree growers have noticed this, Balsam poplar in winter since many of their cultivars require extensive chilling but are planted into orchards that are sometimes too warm to meet the chilling requirements. cientists are now working on incorporating winter chilling into computer-based models that explore how plant phenology will respond to climate change. The traditional view is that climate warming will lead to an extended growing season. However, this may not be accurate if warm winters result in reduced chilling and a delay in spring leaf out. Your field observations of phenology in our PopClock species (Quaking aspen and Balsam poplar) will help us test the timing of spring leaf out and its sensitivity to temperature at different times of the year. D S How do your observations compare to satellite images? S T (Rule 1) = 0.18; C (Rules 1, 2) = 0.35; D (Rules 1, 2, 3) = 0.59. As you can see, applying each of these rules dramatically improved the correlation between the ground-based observations and the satellite observations. This is very impressive!!! A: Original B: Rule Rule 11 B: C: Rules Rules 1 1 and and 2 2 C: D: D: Rules Rules 1, 1, 2, 2, and and 33 300 MODIS Onest of Greeness Increase (DOY) W e are using your ground-based phenophase observations (for example, spring budburst) to understand forest vulnerability to climate change. We began this work by examining the correlation, or agreement, between the phenophase dates from NPN Nature’s Notebook ground observations with phenophase dates determined from images taken with the MODIS satellite. Unfortunately, when we compared these two sets of dates, we found no correlation (see Figure A)! o, we created three filter rules to remove any possible errors in the data. For our first rule, we eliminated volunteer observations that fell outside the obvious time period for each phenophase (for example, we deleted budburst observations that were recorded in October). This rule eliminated about 12% of observations. For our second rule, we eliminated volunteer observations that were not preceded by another observations within at least 10 day for the same phenophase. In other words, if a volunteer recorded the presence of colored leaves, they must have had a prior observation within at least 10 days when they did not observe colored leaves. This ensured that the date for the appearance of colored leaves was accurate. This rule eliminated about 40% of observations. For the third rule, we shifted the MODIS satellite image to a nearby forested area if a volunteer’s tree stand was not surrounded by a forest (for example, it was in a grassland). If there was no nearby forested area, we don’t make this shift. he adjacent figures provide an example of the results by showing the correlation between the dates of the “leaves” phenophase from volunteer ground observations and the date of that same phenophase from the MODIS satellite. In these graphs, DOY stands for “day of the year.” A perfect positive correction would have an r2 equal to 1, and no correlation would have an r2 equal to 0. In the figures, r2 were as follows: A (no rules) = 0.02; B 200 200 100 100 0 0 300 300 200 200 100 0 100 W 200 200 300 300 100 100 NPN Leaves (DOY) 200 300 e presented these findings at the 2015 Citizen Science Association Conference in San Jose California. We are now working on a manuscript for a science journal that will include these comparisons. Our findings provided following guidance for PopClock volunteers. You should... ★★ Check on your tree stand at least every 10 days when you think they are ready to leaf out and change color. ★★ Report the absence of any phenophase. ★★ Take care to record the correct phenophase. ★★ Try to observe a PopClock tree stand within a forested area. It’s time to collect spring data! Spring has sprung! We hope you are heading out to capture spring budburst for your PopClock tree stands. As noted, reporting the absence of a phenophase (like budburst) is just as important as its presence. So get out as often as you can! More info on PopClock With a grant from the National Science Foundation and support from the National Phenology Network, Project Budburst and Plant Watch, University of Maryland Center for Environmental Science Appalachian Laboratory scientists are working with U.S. and Canadian volunteers to collect ground-based observations of spring leaf emergence and fall color change of two poplar species— balsam poplar (Populus balsamifera) and quaking aspen (Populus tremuloides). PopClock scientists will use these phenology observations, along with satellite images across the growing season, to create maps of “green-up” and “green-down” of these two species. They will combine these maps with genetic information to predict areas where trees are most and least adapted to climate change. ★★ ★★ ★★ ★★ ★★ ★★ ★★ Submit PopClock observations through NPN – www.usanpn.org/nn/popclock Review Balsam poplar map - esp.cr.usgs.gov/data/little/popubals.pdf Review Quaking aspen map - esp.cr.usgs.gov/data/little/poputrem.pdf Review Balsam poplar identification - http://dendro.cnre.vt.edu/dendrology/syllabus/factsheet.cfm?ID=401 Review Quaking aspen identification - http://dendro.cnre.vt.edu/dendrology/syllabus/factsheet.cfm?ID=160 Explore our Appalachian Laboratory Environmental Science education program - alese.al.umces.edu Email us if you have any questions or insights to share; we’d love to hear from you! – citizen.science@al.umces.edu


