Technical Note
TN-0039
Working with DBD files in DPlot
1 Opening DBD files with DPlot
When DPlot is installed, it is automatically associated with DBD files. Therefore to open a
DBD file, simply double-click it within Windows Explorer. Alternatively a DBD file can be
dropped onto a DPlot window, which will open the file in that window.
2 The main window
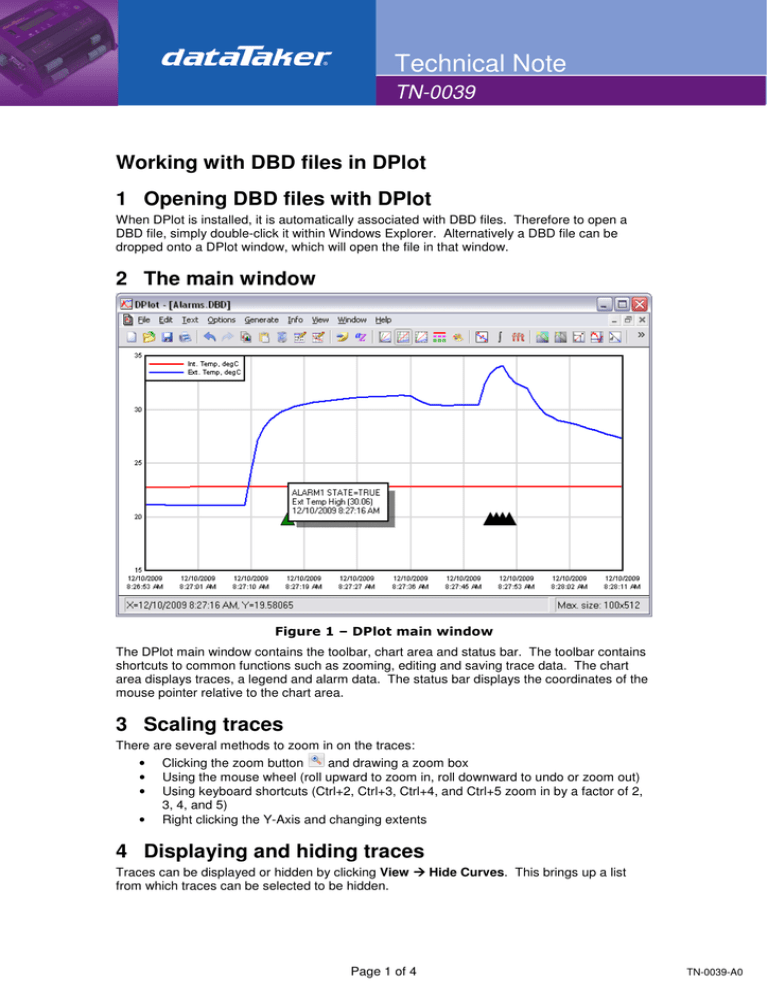
Figure 1 – DPlot main window
The DPlot main window contains the toolbar, chart area and status bar. The toolbar contains
shortcuts to common functions such as zooming, editing and saving trace data. The chart
area displays traces, a legend and alarm data. The status bar displays the coordinates of the
mouse pointer relative to the chart area.
3 Scaling traces
There are several methods to zoom in on the traces:
• Clicking the zoom button
and drawing a zoom box
• Using the mouse wheel (roll upward to zoom in, roll downward to undo or zoom out)
• Using keyboard shortcuts (Ctrl+2, Ctrl+3, Ctrl+4, and Ctrl+5 zoom in by a factor of 2,
3, 4, and 5)
• Right clicking the Y-Axis and changing extents
4 Displaying and hiding traces
Traces can be displayed or hidden by clicking View Hide Curves. This brings up a list
from which traces can be selected to be hidden.
Page 1 of 4
TN-0039-A0
Technical Note
TN-0039
Figure 2 - Hide traces window
Alternatively, a hide trace option is made available by right-clicking on the trace directly or by
clicking the name of the trace in the legend.
5 Multiple axes
To add a second y-axis, right-click on the Y-axis and select Multiple Axes from the pop up
menu, this will bring up the Multiple Axes window (Figure 3). To enable a second Y-axis click
Independent Y2. A list box will then appear, which contains the trace names. Select which
axis each trace will appear on by checking the box to the right and click OK when finished.
Figure 3 - Multiple Axes window
Page 2 of 4
TN-0039-A0
Technical Note
TN-0039
6 Visualising alarm data
DPlot can be used to visualise when alarms had been triggered or reset during a recording. If
a DBD file is opened and it contains alarm data, the user will be prompted whether or not to
display these alarms as shown in Figure 4. The ‘TRUE’ state corresponds to an alarm
OFFON transition and the ‘FALSE’ state corresponds to an alarm ONOFF transition.
Figure 4 - Alarm display prompt
The alarms are displayed as a set of triangular markers underneath the data traces. These
markers are colour-coded based on the alarm number.
If the mouse pointer is hovered over an alarm marker then the corresponding alarm state,
alarm text and the timestamp are displayed in a box as shown in Figure 1.
7 Viewing quick statistics
To view statistics for a dataset, click the List Peaks
button on the toolbar. This displays a
dialog box listing minimum and maximum amplitudes and the point at which they occur, in
addition to the mean, standard deviation and standard error for each trace.
The same can be accomplished for a subset of the data by clicking the List Peaks in Range
button on the toolbar and selecting a data range using the mouse cursor.
8 Viewing and editing raw data
Although DPlot provides mouse-over tooltips to display data points, it may be necessary to
access and view the raw data. To do this, click the Edit Data
button on the toolbar. A
prompt will appear asking which trace to view the data from, select the trace and click OK.
The edit data points window will now appear, displaying the raw data for the selected trace
Figure 5 – Edit data box
Page 3 of 4
TN-0039-A0
Technical Note
TN-0039
9 Exporting data to Excel
To export data (including alarms) to an Excel compatible format (CSV), click File
Save As.
A dialog box will appear which allows the data to be saved in many different formats.
Figure 6 - 'Save As...' dialog box
Select ‘Comma-separated values’ from the dropdown list and type in a filename for the CSV
file to save. This file can now be opened in Excel using your preferred method.
10 More information
For more information about the above and the many other features of DPlot see the help files
in DPlot by clicking Help Contents.
For customer service, call 1300-735-292
To fax an order, use 1800- 067- 639
Visit us online: www.thermofisher.com.au
©2010 Thermo Fisher Scientific Australia Pty Ltd. All rights reserved. A.B.N. 52 058 390 917
TN-0039-A0


