Printed on 09-14-2016
NEI Northwest Canadian Equity Fund
Fund Category
Canadian Focused Equity
Benchmark
80% S&P/TSX Composite TR, 20% S&P 500 TR (CAD)
Investment Objective
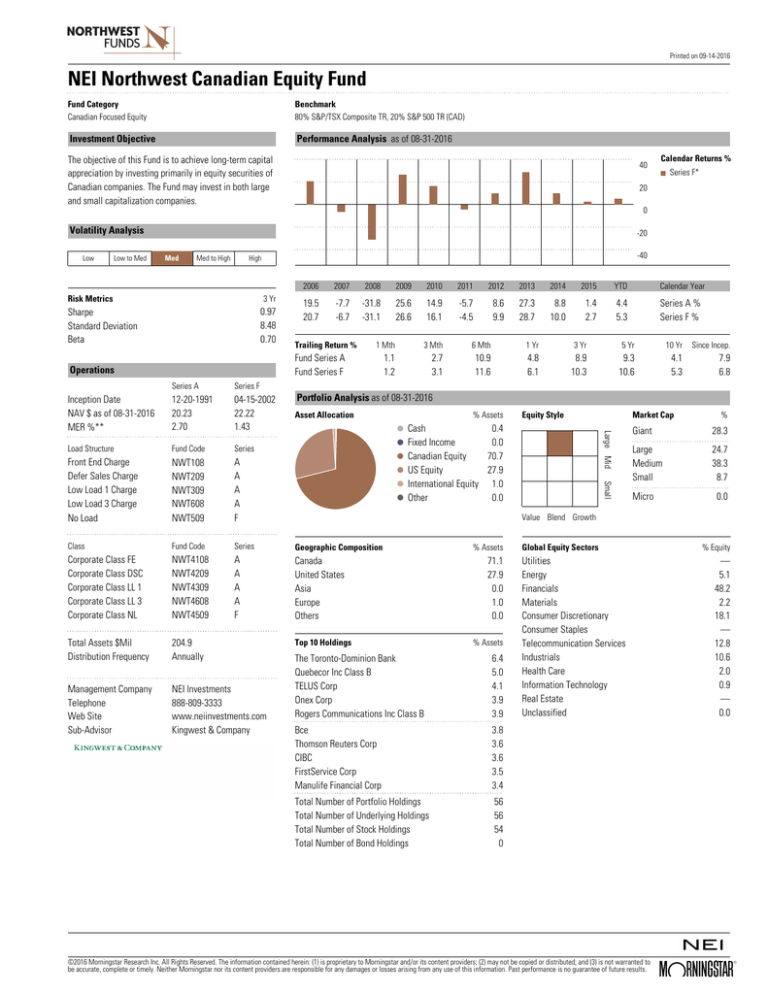
Performance Analysis as of 08-31-2016
The objective of this Fund is to achieve long-term capital
appreciation by investing primarily in equity securities of
Canadian companies. The Fund may invest in both large
and small capitalization companies.
40
Low to Med
Series F*
20
0
Volatility Analysis
Low
Calendar Returns %
-20
Med
Med to High
-40
High
Risk Metrics
3 Yr
0.97
8.48
0.70
Sharpe
Standard Deviation
Beta
2006
2007
2008
2009
2010
2011
2012
2013
2014
2015
YTD
Calendar Year
19.5
20.7
-7.7
-6.7
-31.8
-31.1
25.6
26.6
14.9
16.1
-5.7
-4.5
8.6
9.9
27.3
28.7
8.8
10.0
1.4
2.7
4.4
5.3
Series A %
Series F %
Trailing Return %
1 Mth
3 Mth
6 Mth
1 Yr
3 Yr
5 Yr
10 Yr
Since Incep.
1.1
1.2
2.7
3.1
10.9
11.6
4.8
6.1
8.9
10.3
9.3
10.6
4.1
5.3
7.9
6.8
Fund Series A
Fund Series F
Operations
Series A
Series F
Inception Date
NAV $ as of 08-31-2016
MER %**
12-20-1991
20.23
2.70
04-15-2002
22.22
1.43
Load Structure
Fund Code
Series
Front End Charge
Defer Sales Charge
Low Load 1 Charge
Low Load 3 Charge
No Load
NWT108
NWT209
NWT309
NWT608
NWT509
A
A
A
A
F
Class
Fund Code
Series
Geographic Composition
Corporate Class FE
Corporate Class DSC
Corporate Class LL 1
Corporate Class LL 3
Corporate Class NL
NWT4108
NWT4209
NWT4309
NWT4608
NWT4509
A
A
A
A
F
Canada
United States
Asia
Europe
Others
Total Assets $Mil
Distribution Frequency
204.9
Annually
Management Company
Telephone
Web Site
Sub-Advisor
NEI Investments
888-809-3333
www.neiinvestments.com
Kingwest & Company
Portfolio Analysis as of 08-31-2016
Asset Allocation
% Assets
Equity Style
Market Cap
Large Mid
Cash
0.4
Fixed Income
0.0
Canadian Equity
70.7
US Equity
27.9
International Equity 1.0
Other
0.0
%
Small
Giant
28.3
Large
Medium
Small
24.7
38.3
8.7
Micro
0.0
Value Blend Growth
Top 10 Holdings
% Assets
71.1
27.9
0.0
1.0
0.0
% Assets
The Toronto-Dominion Bank
Quebecor Inc Class B
TELUS Corp
Onex Corp
Rogers Communications Inc Class B
6.4
5.0
4.1
3.9
3.9
Bce
Thomson Reuters Corp
CIBC
FirstService Corp
Manulife Financial Corp
3.8
3.6
3.6
3.5
3.4
Total Number of Portfolio Holdings
Total Number of Underlying Holdings
Total Number of Stock Holdings
Total Number of Bond Holdings
56
56
54
0
Global Equity Sectors
Utilities
Energy
Financials
Materials
Consumer Discretionary
Consumer Staples
Telecommunication Services
Industrials
Health Care
Information Technology
Real Estate
Unclassified
©2016 Morningstar Research Inc. All Rights Reserved. The information contained herein: (1) is proprietary to Morningstar and/or its content providers; (2) may not be copied or distributed; and (3) is not warranted to
be accurate, complete or timely. Neither Morningstar nor its content providers are responsible for any damages or losses arising from any use of this information. Past performance is no guarantee of future results.
% Equity
—
5.1
48.2
2.2
18.1
—
12.8
10.6
2.0
0.9
—
0.0
?
Printed on 09-14-2016
NEI Northwest Canadian Equity Fund
Disclosure
*Series F units are only available if the registered dealer
has entered into a Series F Distribution Agreement with
NEI Investments. No direct sales commissions or
redemption charges are payable by the investor to NEI
Investments on the purchase or sale of Series F units.
**MER for the period ended September 30, 2015
** NEI, at its discretion, currently waives some of its
management fees or absorbs some expenses of certain
NEI funds. This may continue for an indeterminate period
of time and may also be terminated at any time. The
management expense ratios (“MERs”) published above
are calculated after any applicable waivers and
absorptions have been taken into account, based on
audited total expenses (excluding commissions and other
fund transaction costs) for the year ended September 30,
2015. The MERs before waivers or absorptions are
reflected in each fund’s Annual Management Report of
Fund Performance.
The indicated rates of return are the historical annual
compounded total returns including changes in net asset
value and reinvestment of dividends and distributions,
but does not include any sales, redemption or other
account charges or administrative fees payable by the
This document is provided for informational purposes
only and it is not intended to provide specific advice
including, without limitation, investment, financial, tax or
similar matters. Please consult with your own
professional advisor on your particular circumstances.
Commissions, trailing commissions, management fees
and expenses all may be associated with mutual fund
investments. Please read the prospectus and/or Fund
Facts document before investing.
investor which would reduce returns. Mutual funds are
not guaranteed, their values change frequently and past
performance may not be repeated.
Portfolio holdings may change due to ongoing portfolio
transactions of the investment fund.
Northwest Funds, Ethical Funds and NEI Investments are
registered trademarks of Northwest & Ethical
Investments L.P.
©2016 Morningstar Research Inc. All Rights Reserved. The information contained herein: (1) is proprietary to Morningstar and/or its content providers; (2) may not be copied or distributed; and (3) is not warranted to
be accurate, complete or timely. Neither Morningstar nor its content providers are responsible for any damages or losses arising from any use of this information. Past performance is no guarantee of future results.
?


