Frequency stabilization of a continuous-wave Ti:sapphire laser
advertisement

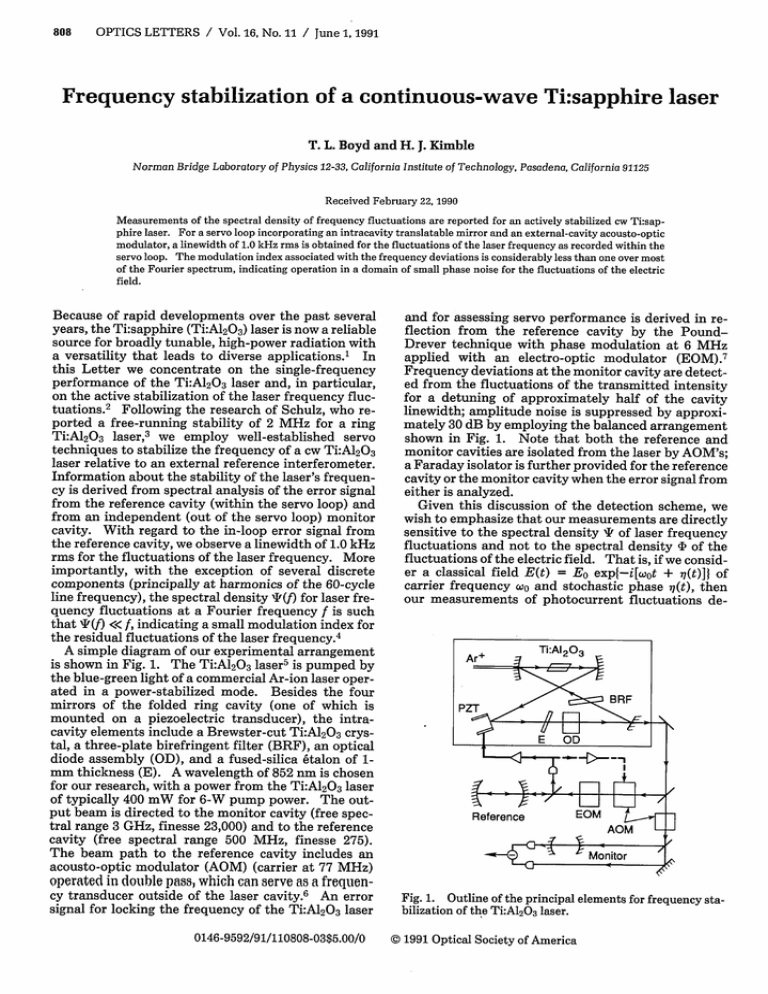
808 OPTICS LETTERS / Vol. 16, No. 11 / June 1, 1991 Frequency stabilization of a continuous-wave Ti:sapphire laser T. L. Boyd and H. J. Kimble Norman Bridge Laboratory of Physics 12-33,California Institute of Technology, Pasadena,California 91125 Received February 22, 1990 Measurements of the spectral density of frequency fluctuations are reported for an actively stabilized cw Ti:sapphire laser. For a servo loop incorporating an intracavity translatable mirror and an external-cavity acousto-optic modulator, a linewidth of 1.0 kHz rms is obtained for the fluctuations of the laser frequency as recorded within the servo loop. The modulation index associated with the frequency deviations is considerably less than one over most of the Fourier spectrum, indicating operation in a domain of small phase noise for the fluctuations of the electric field. Because of rapid developments over the past several years, the Ti:sapphire (Ti:A120 3 ) laser is now a reliable source for broadly tunable, high-power radiation with a versatility that leads to diverse applications.' In this Letter we concentrate on the single-frequency performance of the Ti:A1203 laser and, in particular, on the active stabilization of the laser frequency fluctuations.2 Following the research of Schulz, who reported a free-running stability of 2 MHz for a ring Ti:A1203 laser,3 we employ well-established servo techniques to stabilize the frequency of a cw Ti:A12 03 laser relative to an external reference interferometer. Information about the stability of the laser's frequency is derived from spectral analysis of the error signal from the reference cavity (within the servo loop) and from an independent (out of the servo loop) monitor cavity. With regard to the in-loop error signal from the reference cavity, we observe a linewidth of 1.0 kHz rms for the fluctuations of the laser frequency. More importantly, with the exception of several discrete components (principally at harmonics of the 60-cycle line frequency), the spectral density T(f) for laser frequency fluctuations at a Fourier frequency f is such that T(f) <<f, indicating a small modulation index for the residual fluctuations of the laser frequency.4 A simple diagram of our experimental arrangement and for assessing servo performance is derived in reflection from the reference cavity by the PoundDrever technique with phase modulation at 6 MHz applied with an electro-optic modulator (EOM).7 Frequency deviations at the monitor cavity are detected from the fluctuations of the transmitted intensity for a detuning of approximately half of the cavity linewidth; amplitude noise is suppressed by approximately 30 dB by employing the balanced arrangement shown in Fig. 1. Note that both the reference and monitor cavities are isolated from the laser by AOM's; a Faraday isolator is further provided for the reference cavity or the monitor cavity when the error signal from either is analyzed. Given this discussion of the detection scheme, we wish to emphasize that our measurements are directly sensitive to the spectral density T of laser frequency fluctuations and not to the spectral density b of the fluctuations of the electric field. That is, if we consider a classical field E(t) = E0 expf-i[wot + i7(t)]}of carrier frequency wo and stochastic phase v(t), then our measurements of photocurrent fluctuations de- is shown in Fig. 1. The Ti:A12 03 laser 5 is pumped by the blue-green light of a commercial Ar-ion laser operated in a power-stabilized mode. Besides the four mirrors of the folded ring cavity (one of which is mounted on a piezoelectric transducer), the intracavity elements include a Brewster-cut Ti:A120 3 crystal, a three-plate birefringent filter (BRF), an optical diode assembly (OD), and a fused-silica 6talon of 1mm thickness (E). A wavelength of 852 nm is chosen for our research, with a power from the Ti:A12 03 laser of typically 400 mW for 6-W pump power. The output beam is directed to the monitor cavity (free spectral range 3 GHz, finesse 23,000) and to the reference cavity (free spectral range 500 MHz, finesse 275). The beam path to the reference cavity includes an acousto-optic modulator (AOM) (carrier at 77 MHz) operated in double pass, which can serve as a frequen- cy transducer outside of the laser cavity.6 An error signal for locking the frequency of the Ti:A12 03 laser 0146-9592/91/110808-03$5.00/0 Fig. 1. Outline of the principal elements for frequency stabilization of the Ti:Al 2 0 3 laser. © 1991 Optical Society of America June 1, 1991 / Vol. 16, No. 11 / OPTICS LETTERS I0.2 I 50 0 100 kHz Fig. 2. Spectral density of laser frequency fluctuations 41(f) versus analysis frequency f for a servo employing only the intracavity PZT mirror. The large peak at f = 35 kHz is a calibration signal that results from an externally applied frequency dither of 3.5 kHz rms. The sharp spectral features near 30 kHz arise from noise peaking near the unity gain point of the servo. The data were acquired with an analysis bandwidth of 187 Hz. rived from the interaction of this field with an optical cavity yield information about the quantity = 2f dr exp(2rift)(69(t)50(t + r)), (1) where 69(t) =_ (t). For example, if the field E(t) is incident upon the monitor cavity with a detuning y/2 (-y FWHM of cavity transmission in hertz), then the single-sided spectral density of photocurrent fluctuations produced by the transmitted field for frequencies f <<-y is D(f) _ [2ei + (i 2 /y 2 )qI(f)], with i as the mean photocurrent. D(f) is thus a sum of a shot-noise contribution plus excess noise that results from the conversion of frequency noise into intensity noise by the frequency-dependent transmission function of the cavity. Note that the linewidth Av (hertz) for frequency fluctuations is given by AP2 = fS 'T(f)df, where. we assume throughout that Azv<< y. By contrast, the spectral density 4'(f) for fluctuations of the electric field is found through the Wiener-Khintchine theorem as the Fourier transform of the autocorrelation function of E(t), with corresponding linewidth AAt. While P(f) is the relevant quantity for many of the applications that we have in mind (e.g., spectroscopy), our measurements provide direct information only about W(f).4 Turning now to our observations of the frequency fluctuations of the Ti:Al20 3 laser, Fig. 2 presents the quantity T(f) over the range 0 < f < 100 kHz for a servo arrangement employing the intracavity piezoelectrically translated (PZT) mirror as the single active element. The unity gain point for the servo is at f 30 kHz; there is appreciable gain only for frequencies below approximately 5 kHz. Above approximately 10 kHz, T(f) for the locked laser and for the free-. considered (O < f < ft) is shown in Fig. 3 together with the modulation index 6 Av(fc)/fc. Forff> 10kHz, we see that the native noise spectrum of the laser approaches a regime for which a typical frequency excursion persists for a sufficiently short duration to compound a phase 27rb < 1. For analysis frequencies greater than the 100-kHz range shown in Fig. 2 and extending to the linewidth of our reference cavity (f c 2 MHz), the spectrum of frequency fluctuations is essentially flat at the level shown near 100 kHz (corresponding to the measurement noise floor), with the exception of a small rise of approximately 5 dB near 200 kHz. While the spectra presented in Figs. 2 and 3 are derived from an analysis of the in-loop error signal of the reference cavity, we have also made extensive measurements with the independent out-of-loop monitor cavity. For analysis frequencies f$> 5 kHz, the spectra T'Im(f) obtained from the monitor cavity are nearly identical to the in-loop spectra. However, at lower (f c 500 Hz), Tm (f) rises steeply above T(f) of the reference cavity with a dominance of specfrequencies tral features near 50 Hz that lead to a linewidth APV 15 kHz. While we have no conclusive evidence, we suggest that this disparity between in-loop and out-ofloop measurements is principally associated with the (differential) stability of the monitor and reference cavities; similar behavior was encountered in our previous research with the external-cavity frequency stabilization of a cw dye laser. 8 below a few kilohertz, T(f) for the free- running laser is quite large, leading to an rms linewidth of approximately 700 kHz (3 Hz < f S 1 MHz). By contrast, '(f) for the locked laser reaches a continuum level of roughly 20 Hz for f < 1 kHz (with several larger noise peaks above the continuum) and has an rms linewidth of 3.8 kHz. The dependence of this linewidth Av on the range of Fourier frequencies Concerning the longer- term frequency drift of the locked laser observed by the monitor cavity, we find highly variable results that depend on the laboratory environment, ranging from rates as high as 50 kHz/s to rates of roughly 1 kHz/s, which we again attribute principally to the differential stability of the diagnostic cavities. Although the inloop error signal from the reference cavity is not a sufficient diagnostic of the stability of the laser, we nonetheless believe that it is more indicative of the characteristics of the Ti:A12 03 laser than are our measurements involving two diagnostic cavities and, therefore, make it the focus of our attention in what follows. As indicated by the dashed path in Fig. 1, an external-cavity AOM can also be employed as part of the 4 0.4 3 0.3 I N _r _d x1) x 2 0.2 1 0.1 -1 running laser are similar. However, for analysis frequencies 809 ~~~~x I + I I 3 10 10 4 105 I 106 fc (Hz) Fig. 3. Linewidth for frequency fluctuations AP'(filled circles) and modulation index 6 = APv(fc)/f (crosses) versus cutoff frequency fc. The data are for a servo with an intracavity PZT mirror only. 810 OPTICS LETTERS / Vol. 16, No. 11 / June 1, 1991 4(b) is T(f) 7.0 Hz, which with the analysis of Ref. 4 indicates a linewidth for the fluctuations of the electric field of A, I 700 , 70 is of the order of AAu 7r(Av2/f,) frequency f/ = 50 kHz.4 I I I | i I I I . (C) I 700 B 70 7 0.7 -xT n 20 Hz. More generally, if we include all spectral features in Fig. 4, then the measured linewidth for frequency fluctuations is AP = 1.0 kHz, which suggests that the width of the spectrum 4b 1J I.. A!)II1, I'I.,1I , It 0.5 Ik. 11;(Hz Fig.4. Spectral density of laser frequency fluctuations '(f) (solid curves) versus analysis frequency f for a servo employ- ing both the intracavity PZT mirror and an external-cavity AOM. The dotted curves are the equation T(f) = f, with T(f) < f indicating a domain of small modulation index. The dashed line in (a) gives the noise level with the reference cavity tuned far from resonance and is the open-loop noise floor. _ 60 Hz for a cutoff In summary, a characterization of the frequency fluctuations of a cw Ti:Al2 03 laser has been presented. Two servo arrangements have been discussed with an intracavity PZT mirror alone and with an additional external-cavity AOM, which result in linewidths of 3.8 and 1.0 kHz, respectively, for the fluctuations of laser frequency as recorded within the servo loop. With the exception of several discrete components, the spectral analysis of the frequency fluctuations for the in-loop error signal indicates operation in a regime of small modulation index for the phase of the electric field. Beyond these initial efforts, significant improvements should follow from the implementation of a fast-intensity servo to remove line-related transients from the pump laser. Additionally, the construction of diagnostic cavities with greatly improved stability9 should enhance our ability to make independent measurements outside of the servo loop. Note added in proof: Since this paper was submitted, similar measurements of the frequency stabilization of a Ti:A12 03 laser have been reported.1 0 This research was supported by the Venture Research Unit of British Petroleum and by the U.S. Office of Naval Research. We gratefully acknowledge the contributions of Y. Shevy, who was involved in the preliminary phase of the research. References 1. See the special issue on solid state lasers, IEEE J. Quantum Electron. 24, 995-1051 (1988). servo by directing part of the error signal derived from the reference cavity to a voltage-controller oscillator, which in turn drives the AOM to close the externalcavity loop, with the PZT mirror still active inside the laser cavity. Noise spectra T(f) recorded for this mode of operation are displayed in Fig. 4. Also displayed as a dotted curve is the relation T(f) = f, with the regime of small modulation index (or phase noise) defined by T(f) <<f and that of large modulation index (or frequency noise) given by T(f) >>f. With the exception of the sharp spectral features principally at harmonies of 60 Hz (which arise from small periodic transients on the intensity of the pump laser), the continuum component of frequency fluctuations of the Ti:A12 03 laser lies in the domain of small noise modulation. For example, the continuum level in Fig. 2. T. L. Boyd and H. J. Kimble, in Digest of Annual Meeting of the Optical Society of America (Optical Society of America, Washington, D.C., 1989), paper TuOl. 3. P. A. Schulz, IEEE J. Quantum Electron. 24, 1039 (1988). 4. D. S. Elliott, R. Roy, and S. J. Smith, Phys. Rev. A 26,12 (1982). 5. Schwarz Electro-Optics Titan cw Ti:A12 0 3 laser. 6. J. L. Hall and T. Ha.nsch,Opt. Lett. 9, 502 (1984). 7. R. W. P. Drever, J. L. Hall, F. V. Kowalski, J. Hough, G. M. Ford, A. J. Munley, and H. Ward, Appl. Phys. B 31, 97 (1983). 8. T. L. Boyd and H. J. Kimble, J. Opt. Soc. Am. A 3, 120 (1986); T. L. Boyd, master's thesis (University of Texas at Austin, Austin, Tex., 1987). 9. C. Salomon, D. Hils, and J. L. Hall, J. Opt. Soc. Am. B 5, 1576 (1988). 10. W. Vassen, C. Zimmermann, R. Kallenbach, and T. W. Hdnsch, Opt. Commun. 75, 455 (1990).


