PDF - Scholar Science Journals
advertisement
International Journal of Advances in Pharmaceutics
ISSN: 2320–4923; DOI: 10.7439/ijap
Volume 3 Issue 1 [2014]
Journal home page:http://ijap.ssjournals.com
Research Article
Development of validated RP-HPLC method for the simultaneous
estimation of atenolol and chlorthalidone in combine tablet dosage form
M. S. Charde*1, A. S. Welankiwar1 and R. D. Chakole2
*Government College of Pharmacy, Kathora Naka, Amravati-444604, (M.S.) India – 444604
*Correspondence Info:
M. S. Charde
Government College of Pharmacy,
Amravati, MS India 444604
Email: manojudps@rediffmail.com
Keywords:
ATN,
CTN,
RP-HPLC,
Assay method,
Method Validation
,
Abstract
A RP-HPLC method for the estimation of ATN (Atenolol) and CTN
(chlorthalidone) in combined dosage form was developed using Comosil RP-C18 (4.6
x 250mm, 5µm) in an gradient mode with mobile phase comprising of Methanol:
Water (pH 3 using OPA) The flow rate was 1 mL/ min and effluent was monitored at
226.0 nm. The retention times were found to be 2.2 min for ATN and 3.36 min for
CTN. The assay exhibited a linear dynamic range of 40- 200 µg/mL for ATN and 1050 µg/mL for CTN. The calibration curves were linear (r 2 = 0.999 for ATN and r2 =
0.999 for CTN) over the entire linear range. Mean % recovery was found to be 99.78 %
for ATN and 99.30 % for CTN with % RSD was NMT 2 for both estimations which
fully agrees with system suitability which is in good agreement with labeled amount of
formulation. The % RSD for Intra- Day & Inter-Day Precision was NMT than 2 for
both the drugs. The developed method was validated as per ICH guidelines
1. Introduction
The technique High Performance Liquid Chromatography (HPLC) is so called because of its improved
performance over the classical column chromatography. The technique basically involves the use of porous material as a
stationary phase and the liquid mobile phase is pumped into the column under high pressure. The development of this
technique is attributed to the small particle size of stationary phase. As the particle size is small the resistance to the flow of
mobile phase is very high that is the reason why the high pressure is recommended. 1, 18 Analytical method development and
validation are key elements of any pharmaceutical development program. HPLC analysis method is developed to identify,
quantity or purifying compounds of interest. This technical brief will focus on development and validation activities as
applied to drug products. Method validation is the process of proving that an analytical method is acceptable for its intended
purpose. The parameters for method validation as defined by ICH (International Conference on Harmonization) guidelines
are Accuracy, Precision, Specificity, Limit of Detection, Limit of Quantitation, Linearity, Range, Robustness and
Ruggedness2. From the literature review7-16 it has been found that only three analytical methods for the above combination
have been reported. Therefore the attempt is made to develop simple, accurate, precise rapid and economical RP-HPLC
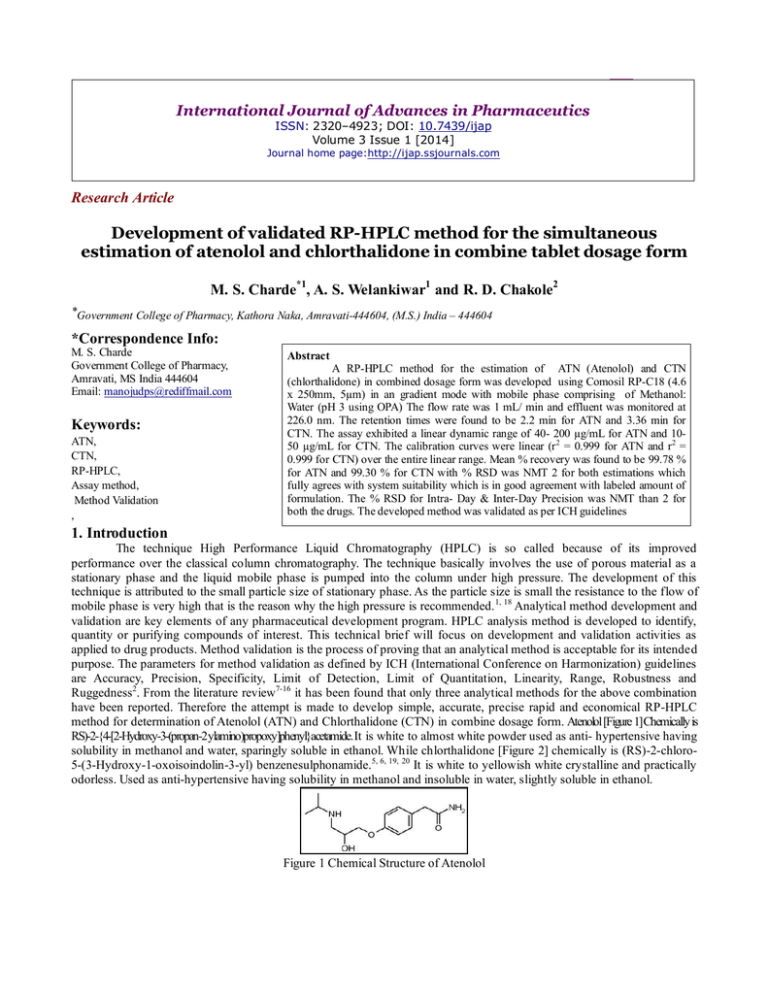
method for determination of Atenolol (ATN) and Chlorthalidone (CTN) in combine dosage form. Atenolol [Figure 1]Chemically is
RS)-2-{4-[2-Hydroxy-3-(propan-2ylamino)propoxy]phenyl}acetamide. It is white to almost white powder used as anti- hypertensive having
solubility in methanol and water, sparingly soluble in ethanol. While chlorthalidone [Figure 2] chemically is (RS)-2-chloro5-(3-Hydroxy-1-oxoisoindolin-3-yl) benzenesulphonamide.5, 6, 19, 20 It is white to yellowish white crystalline and practically
odorless. Used as anti-hypertensive having solubility in methanol and insoluble in water, slightly soluble in ethanol.
Figure 1 Chemical Structure of Atenolol
International Journal of Advances in Pharmaceutics 3 (1) 2014
7
Figure 2 Chemical Structure of Chlorthalidone
2. Experimentals
2.1 Reagents & Chemicals
Standard samples of ATN & CTN were received as gift samples from the leben laboratories akola (Maharashtra)
and IPCA Laboratories mumbai (Maharashtra). The marketed formulation Tenoric (IPCA Laboratories) was purchased from
the local market containing ATN 50 mg and CTN 12.5 mg and all the chemicals used were are of analytical grade.
2.2 Instruments
HPLC System of Younglin Quaternary pump with UV- VIS detector (190-990 nm) Software – Autochro. Analytical
balance of citizen model CY 104 (microanalytical balance) was used for weighing purpose also the ultrasonicator servewell
instruments model RC-SYSTEM MU-1700 used for sonication purpose.
2.3 Preparation of Standard Solutions
Standard Stock Solution (A) Accurately weighed quantity of ATN (40.0 mg) was transferred to 10.0 mL volumetric flask
and dissolved in methanol. The volume was made up to mark with methanol to get final concentration of 4000 µg/mL. The
resultant solution was then sonicated for 10.0 min in ultrasonicator.
Standard Stock Solution (B) Accurately weighed quantity of CTN (10.0 mg) was transferred to 10.0 mL volumetric flask
and dissolved in methanol. The volume was made up to mark with methanol to get final concentration of 1000 µg/mL. The
resultant solution was then sonicated for 10.0 min in ultrasonicator.
Working Standard Solution (C) 0.1 mL of solution (A) and 0.1 mL of solution (B) was transferred to 10.0 mL volumetric
flask and then the volume was made up to the mark with mobile phase to get final concentration of (40.0 µg/mL of ATN &
10.0 µg/mL of CTN) respectively. The resultant solution was then sonicated for 10.0 min in ultrasonicator.
2.4 Optimization of Mobile Phase and Chromatographic Conditions
Procedure: The chromatographic conditions were set as per the optimized parameters. The mobile phase was allowed to
equilibrate with stationary phase as was indicated by a steady baseline. Solution (C) was injected in the Rheodyne injector
(20.0 µl) and the respective chromatograms were recorded. Various mobile phases were tried by permutations and
combinations and also by varying column, flow rate, column temperature and type of buffers with varying pH and solvents.
The various mobile phases tried are as follows.
Trial 1 Methanol: Water (80: 20) pH 7
Trial 2 Methanol: Water (60: 40) pH 7
Trial 3 Methanol: Water (50:50) pH 7
Trial 4 Methanol: Water (35: 65) pH 7
Trial 5 Acetonitrile: Methanol: Water (15: 30: 55) pH 7
Trial 6 Methanol: Water (60: 40) pH 3
Above mentioned various mobile phases were tried. The mobile phase containing Methanol: water (60: 40) at pH 3,
injection volume-20.0 µL flow rate of 1mL/min was selected, due to its high resolving power, sensitivity and suitability, for
the determination of ATN and CTN. The chromatogram is shown in Figure 1. Hence the following optimized
chromatographic parameters were selected to carry out further experimentation.
Column
: Comosil RP-C18 (4.6 x 250mm, 5µm)
Flow Rate
: 1 mL/min
Wavelength
: 226.0 nm
Injection Volume
: 20.0 µL
Column Temperature : Ambient
Run Time
: 20.0 min
Mobile Phase
: Methanol: Water (60:40)
pH
: 3 (Using OPA)
2.5 System Suitability Studies
System suitability is a pharmacopoeial requirement and is used to verify, whether the resolution and rep roducibility
of the chromatographic system are adequate for analysis to be carried out. It is performed to ensure that the system is
operating properly and read to deliver results with acceptable accuracy and precision. The tests were performed by collecting
data from five replicate injections of standard solutions.
International Journal of Advances in Pharmaceutics 3 (1) 2014
8
Procedure: The chromatographic conditions were set as per the optimized parameters and mobile phase was allowed to
equilibrate with stationary phase as was indicated by the steady baseline. Five replicate injections of mixed working
standard solution (C) were injected in to the system, the chromatograms were recorded for both the drugs and the results are
shown in Table 1 & 2.
2.6 Analysis of Standard Laboratory Mixtures
Preparation of Standard Laboratory Mixtures (Standard)
ATN Standard Stock Solution (A) Accurately weighed quantity of ATN (40.0 mg) was transferred to 10.0 mL volumetric
flask and dissolved in methanol. The volume was made up to mark with methanol to get final concentration of (4000 µg/mL
of ATN). The resultant solution was then sonicated for 10.0 min in ultrasonicator.
CTN Standard Stock Solution (B) Accurately weighed quantity of CTN (10.0 mg) was transferred to 10.0 mL volumetric
flask and dissolved in methanol. The volume was made up to mark with methanol to get final concentration of (1000 µg/mL
of CTN). The resultant solution was then sonicated for 10.0 min in ultrasonicator.
Mixed Standard Solutions 0.1 mL of solution (A) and 0.1 mL of solution (B) was then transferred to 10.0 mL volumetric
flask and volume was made up to the mark with mobile phase to get final concentration of (40.0 µg/mL of ATN & 10.0
µg/mL of CTN) respectively. Similarly 0.2 mL of solution (A) and 0.2 mL of solution (B) was then transferred to 10.0 mL
volumetric flask and volume was made up to the mark with mobile phase to get final concentration of (80.0 µg/mL of ATN
& 20.0 µg/mL of CTN) respectively. The resultant solutions were then sonicated for 10.0 min in ultrasonicator.
Preparation of Standard Laboratory Mixtures (Sample)
Accurately weighed 50.0 mg of ATN and 12.5 mg of CTN (as per labeled requirement of marketed formulation) was
transferred to 50.0 mL volumetric flask and dissolved in sufficient quantity of methanol. Then the volume was made up to
the mark with methanol. The resultant solution was then sonicated in ultrasonicator for 10.0 min. then aliquot portions of
0.4 mL and 0.8 mL was then transferred to two separate 10.0 mL volumetric flask and then volume was made up to the
mark with mobile phase to get final concentrations of (40.0 µg/mL & 80.0 µg/mL of ATN and 10.0 µg/mL & 20.0 µg/mL of
CTN) respectively. The peak area of standard laboratory mixture and sample laboratory mixture was compared to obtain the
concentration. The amount of each drug estimated in laboratory mixture was calculated using following formula –
At
Ds
Ws
% Estimation =
x
x
x 100
As
Dt
Wt
Where,
At =
Area count for sample solution
As =
Area count for standard solution
Ds =
Dilution factor for standard
Dt =
Dilution factor for sample
Ws =
Weight of standard (mg)
Wt =
Weight of sample (mg)
The results are shown in Table 3.
2.7 Analysis of Marketed Formulation
Preparation of Standard Solutions
Prepared as per the methodology adopted for laboratory mixtures
Preparation of Sample Solutions
Ten Tablets were weighed accurately and ground to fine powder. An accurately weighed quantity of Tablet powder
equivalent to (50 mg of ATN & 12.5 mg of CTN) were transferred to 50.0 mL of vo lumetric flask and dissolved in sufficient
amount of methanol. Then the volume was made up to the mark with methanol. The resultant solution was then filtered
through whatman filter paper (no. 41). The filtered solution was then sonicated in ultrasonicator for 10.0 min. aliquot
portions of 0.8 mL was then transferred to the three separate 10.0 mL volumetric flask and then the volume was mad up to
the mark with mobile phase to get final concentration of (80.0 µg/mL of ATN and 20.0 µg/mL of CTN) respectively.
Procedure: Equal volume (20.0 L) of standard and sample solution was injected separately after equilibrium of stationary
phase. The chromatograms were recorded and the response i.e. peak area of major peaks were measured. The amount of
drug in a Tablet was calculated using following formula
AT1 x WS1 x Ds x P1
mg/Tablet = ------------------------------- x Avg. wt
AS1 x WT x Dt
Where,
AT1
= Average area of ATN/CTN peaks in Test chromatogram
AS1
= Average area of ATN/CTN peaks in Standard chromatogram
Ds
= Dilution factor for standard
International Journal of Advances in Pharmaceutics 3 (1) 2014
9
Dt
= Dilution factor for test
P1
= Potency of working standards of ATN/CTN of % w/w basis
Avg. wt = Average weight of 10 Tablets
Further calculate the amount of ATN/CTN present in % of Label claim using following formula
Assay (mg/Tablet) x 100
% Label Claim = -----------------------------------Label claim of ATN/CTN
The results are shown in Table 4, while chromatogram is shown in Figure 4.
2.8 Method Validation
1. Linearity
Preparation of Standard Solutions
ATN Standard Stock Solution (A) Accurately weighed quantity of ATN (40.0 mg) was transferred to 10.0 mL volumetric
flask and dissolved in methanol. The volume was made up to mark with methanol to get final concentration of (4000 µg/mL
of ATN). The resultant solution was then sonicated for 10.0 min in ultrasonicator.
CTN Standard Stock Solution (B) Accurately weighed quantity of CTN (10.0 mg) was transferred to 10.0 mL volumetric
flask and dissolved in methanol. The volume was made up to mark with methanol to get final concentration of (1000 µg/mL
of CTN). The resultant solution was then sonicated for 10.0 min in ultrasonicator.
Mixed Standard Solutions aliquots portions of 0.1 to 0.5 mL from the standard stock solutions (A & B) were transferred to
five 10.0 mL volumetric flasks and then volume was made up to the mark with mobile phase to get 5 different mixed
standard solutions having concentrations of (40.0:10.0, 80.0:20.0, 120.0:30.0, 160.0:40.0, 200.0:50.0 µg/mL of ATN &
CTN) respectively. The resultant solutions was then sonicated in ultrasonicator for 10.0 min
Procedure Equal volumes (20.0 L) of 5 mixed standard solutions were injected separately after equilibrium of stationary
phase. The chromatograms were recorded and the response i.e. peak area of major peaks were measured. Then calibration
curve (Peak area vs concentration) was plotted and it is shown in Figure 5 & 6. The observations are shown in Table 5.
2. Accuracy
Preparation of Standard Solutions Standard solutions of (ATN & CTN) were prepared at the level of 80 %, 10.00 %, 120
%.
Preparation of Sample Solution To the preanalysed sample solution (80 µg/mL of ATN & 20 µg/mL of CTN) a known
amount of standard solutions of pure drugs (ATN & CTN) were added in different levels i.e. 80%, 10.00 %, 120%. The
results of recovery studies shown in Table 6. The percent recovery was then calculated by using formula;
Ew - B
% Recovery = ---------- X 100
C
Where,
Ew = Total drug estimated (mg)
B= Amount of drug contributed by pre analyzed Tablet powder (mg)
C= Weight of pure drug added (mg)
3. Precision
3.1 Intra-Day Precision
It was determined by analyzing the 3 different solutions having concentration (80.0 µg/mL of ATN & 20.0 µg/mL of CTN)
at 3 different times over a period of day.
3.2 Inter-Day Precision
It was determined by analyzing the 3 different solutions having concentration (80.0 µg/mL of ATN & 20.0 µg/mL of CTN)
at 3 days over a period of week.
Procedure Equal volumes (20.0 L) of these solutions were injected separately after equilibrium of stationary phase. The
chromatograms were recorded and the response i.e. peak areas, retention time of major peaks were measured. The results
are shown in Table 7 & 8.
4. Specificity
Specificity is an ability to measures accurately and specifically the analyte of interest in the other components that may be
expected to be present in the sample matrix.
Preparation of Standard Solutions The standard solutions were prepared as per the methodology adopted for laboratory
mixtures.
Preparation of Sample Solution: Sample solution of marketed formulation was prepared as per the methodology adopted
for marketed formulation analsis.
Procedure: Equal volume (20.0 L) of standard and sample solution was injected separately after equilibrium of stationary
International Journal of Advances in Pharmaceutics 3 (1) 2014
10
phase. The chromatograms were recorded and the response i.e. peak area, retention time of the major peaks were measured.
Along with this the interference between the active ingredient and its excipients was also checked. The corresponding
chromatograms are shown in Figure 12 & 13.
5. Robustness
Preparation of Sample Solution: Sample solution of marketed formulation was prepared as per the methodology adopted
for marketed formulation analysis.
Procedure: Equal volume (20.0 L) of sample solution was injected separately after equilibrium of stationary phase. Then
deliberate variation in method parameters such as flow rate (<0.2mL/min), change in detection wavelength (<2 nm) was
carried out. The chromatograms were recorded and the response i.e. peak area, retention time of the major peaks were
measured. The results are shown in Table 9 chromatograms are shown in Figure 14 & 15.
6. Ruggedness
Ruggedness of the method was studied by two different analysts using same operational and environmental
conditions. A sample solutions prepared as per the methodology adopted in section 5.2 having concentration (80.0 µg/mL of
ATN & 20.0 µg/mL of CTN) respectively, were analyzed and concentrations were determined. The results are shown in
Table 10.
3. Results and Discussion
Optimization of Mobile Phase and Chromatographic Conditions
Figure 3 Optimized Chromatogram of ATN & CTN
Observation
Good resolution with minimized tailing also proper peak shape and system suitability was observed within the
limits. Hence the above chromatographic parameters are finalized.
System Suitability Studies
Table 1 Result of System Suitability Studies for (ATN)
System Suitability Test (ATN)
Area
Tailing
Theoretical
Sr. No
Retention Time
Resolution
Reproducibility
Factor
Plates
1
2840
2.3
1.71
0
3303
2
2853
2.3
1.71
0
3303
3
2856
2.31
1.71
0
3322
4
2854
2.31
1.71
0
3322
5
2860
2.31
1.72
0
3322
2852.6
2.306
1.712
0
3314.4
Mean
7.536
0.0054
0.0044
0
10.40
SD
0.264
0.237
0.261
0
0.313
%RSD
Limit
NMT 2%
NMT 1%
<2
>2
> 2000
11
International Journal of Advances in Pharmaceutics 3 (1) 2014
Observation
All the parameters of system suitability are observed within the limits for ATN.
Table 2 Results of System Suitability Studies for (CTN)
System Suitability Test (CTN)
Area
Tailing
Sr. No
Retention Time
Resolution
Reproducibility
Factor
1
1366
3.51
1.75
3.31
2
1376
3.51
1.75
3.31
3
1379
3.51
1.81
3.27
4
1363
3.51
1.75
3.31
5
1375
3.5
1.75
3.27
1371.8
3.508
1.762
3.294
Mean
6.90
0.0044
0.0268
0.021
SD
0.503
0.127
1.52
0.665
%RSD
Limit
NMT 2%
NMT 1%
<2
>2
Theoretical
plates
2460
2460
2460
2460
2698
2507.6
106.43
4.24
> 2000
Observation
All the parameters of system suitability are observed within the limits for CTN.
Analysis of Standard Laboratory Mixtures
Analysis of Standard Laboratory Mixture
Sr.
No
1
2
Standard
Amount
Taken
[µg/mL]
ATN
CTN
40
10
80
20
Sample Amount
Taken [µg/mL]
ATN
40
80
Area of
Standard
Area of Sample
CTN
ATN
CTN
ATN
CTN
10
2840
1366
2825
1361
20
3840
1383
3827
1376
3340
1374.5
3326
1368.5
Mean
707.1
12.02
708.5
10.6
SD
21.17
0.874
21.3
0.775
%RSD
Table 3 Results of Analysis of Standard Laboratory Mixtures
% Amount
Estimated
ATN
99.47
99.66
99.56
0.134
0.1346
Analysis of Marketed Formulation
Table 4 Results of Marketed Formulation Analysis
Analysis of Marketed Formulation
Standard
Sample
Amount
Sr.
Amount
Area of
Amount Taken
Area of Sample
Found
No
Taken
Standard
[µg/mL]
[µg/mL]
[µg/mL]
ATN
CTN
ATN
CTN
ATN
CTN
ATN
CTN
ATN
CTN
1
80
20
3068
1510
79.9
19.9
2
80
20
80
20
3102
1540
3080
1521
80.5
20.3
3
80
20
3075
1517
80.2
20.1
3074.3
1516
80.2
20.1
Mean
6.0
5.56
0.3
0.2
SD
0.19
0.367
0.374
0.99
%RSD
CTN
99.63
99.49
99.56
0.099
0.0995
% Amount
Found
ATN
99.875
100.62
100.25
100.25
0.375
0.374
CTN
99.5
101
100.5
100.5
1
0.995
12
International Journal of Advances in Pharmaceutics 3 (1) 2014
Figure 4 Chromatogram of Marketed Formulation
The proposed method was applied to the determination of ATN & CTN in marketed formulation the mean %
amount found was 100.25 (ATN) & 100.5 (CTN) with % RSD values is NMT 2.0% indicates the developed method was
successfully applied for analysis of marketed formulation. All the results found are in good agreement with the label content
of marketed formulation.
Method Validation
1. Linearity
Linearity of Atenolol
Peak Area
10000
y = 46.51x + 38.8
R² = 0.999
8000
6000
4000
2000
0
0
50
100
150
200
250
Concentration (µg/mL)
Figure 5 Calibration Curve of ATN
Linearity of Chlorthalidone
5000
y = 90.35x - 9.9
R² = 0.999
Peak Area
4000
3000
2000
1000
0
0
10
20
30
40
Concentration (µg/mL)
50
60
13
International Journal of Advances in Pharmaceutics 3 (1) 2014
Figure 6 Calibration Curve of CTN
Table 5 Linearity Studies of ATN & CTN
Concentration (µg/mL)
Peak Area
ATN
CTN
ATN
CTN
40
10
1844
870
80
20
3840
1838
120
30
5640
2696
160
40
7420
3585
200
50
9356
4514
Mean
5620
2700.6
SD
2942.13
1428.79
%RSD
52.35
52.90
In both calibration curves the r2 value was found to be 0.999 which nearly equals to unity. The regression equation
for ATN was y = 46.51x + 38.8 while for CTN it was y = 90.35x - 9.9. It indicates the capability of developed method to
estimate both the drugs over the desired concentration range.
Figure 7 Linearity Chromatogram for (40 µg/mL of ATN & 10 µg/mL of CTN)
Figure 8 Linearity Chromatogram for (80 µg/mL of ATN & 20 µg/mL of CTN)
International Journal of Advances in Pharmaceutics 3 (1) 2014
14
Figure 9 Linearity Chromatogram for (120 µg/mL of ATN & 30 µg/mL of CTN)
Figure 10 Linearity Chromatogram for (160 µg/mL of ATN & 40 µg/mL of CTN)
Figure 11 Linearity Chromatogram for (200 µg/mL of ATN & 50 µg/mL of CTN)
2. Accuracy
This is performed on the basis of recovery studies by standard addition method. Standard solutions of pure drugs (ATN &
CTN) were added in different levels i.e. 80%, 100 %, 120%.
15
International Journal of Advances in Pharmaceutics 3 (1) 2014
Table 6 Results of Recovery Studies
Recovery Studies
Sr.
No
Pre-analysed
Sample Solution
[µg/mL]
Excess Pure
Drug Added
[µg/mL]
Amount
Recovered
[µg/mL]
Area
% Recovery
ATN
CTN
ATN
CTN
ATN
CTN
ATN
CTN
ATN
CTN
1
80
20
64
16
63.8
15.8
6144
3231
99.68
98.75
2
80
20
80
20
79.9
20
7680
4038
99.87
100
3
80
20
96
24
95.8
23.8
9216
4845
99.79
99.16
Mean
99.78
99.30
SD (n=3)
0.093
0.636
% RSD
0.094
0.640
(n=3)
The mean % recovery with % RSD for ATN was found to be 99.78, 0.094 while for CTN it was 99.30, 0.640.
The % RSD here does not exceed 2 which fully agrees with system suitability hence the developed RP-HPLC method was
found to be sufficiently accurate.
3. Precision
3.1 Intra- Day Precision
Table 7 Results of Intra- Day Precision Studies
Sr.
No
1
2
3
ATN
CTN
ATN
CTN
ATN
CTN
Amount
Found
[µg/mL]
ATN CTN
80
20
2.3
3.5
3068
1510
79.9
19.9
99.8
99.5
80
20
2.3
3.5
3072
1516
80.2
20.1
100.2
101
80
20
2.31
3.5
3076
1517
80.5
20.3
100.6
102
Mean
SD
%RSD
2.30
0.005
0.25
3.5
0
0
3072
4
0.13
1514.3
3.78
0.25
80.2
0.3
0.37
20.1
0.2
0.99
100.2
0.375
0.37
101
1
1
Amount Taken
[µg/mL]
Samples
Precision 1 (Ist
Time)
Precision 2 (II
nd
Time)
Precision 3
(III rd Time)
Retention
Time
Area of Peaks
% Amount
Found
ATN
CTN
3.2 Inter- Day Precision
Sr.
No
1
2
3
Samples
Precision
1(Day 1)
Precision
2(Day 2)
Precision
3(Day 3)
Table 8 Results of Inter- Day Precision Studies
Amount
Amount Taken
Retention
Area of Peaks
Found
[µg/mL]
Time
[µg/mL]
ATN
CTN
ATN
CTN
ATN
CTN
ATN
CTN
% Amount
Found
ATN
CTN
80
20
2.3
3.51
3072
1510
80.2
19.9
100.25
99.5
80
20
2.31
3.5
3075
1508
80.35
19.8
100.43
99
80
20
2.3
3.51
3070
1512
80.3
20.2
100.37
101
Mean
SD
%RSD
2.30
0.005
0.25
3.50
0.006
0.16
3072
2.51
0.08
1510
2
0.132
80.2
0.076
0.095
19.9
0.20
1.04
100.3
0.09
0.095
99.8
1.04
1.042
International Journal of Advances in Pharmaceutics 3 (1) 2014
16
Precision was determined as Intra-day & Inter-day precision. Reproducibility in retention time and peak area is
seen in both intra and inter day precision studies with a %RSD (NMT than 2%) for both retention time and peak area
which is in agreement with system suitability. Therefore, the proposed HPLC method for the determination of ATN and
CTN in a tablet was found to be sufficiently precise.
4. Specificity
Figure 12 Chromatogram of ATN & CTN Working Standards
Figure 13 Chromatogram of Marketed Formulation (Specificity)
In the chromatogram obtained with working standard and marketed formulation solution interference is not
observed at the retention time of any peak. Therefore, the proposed HPLC method for the determination of ATN and CTN in
a tablet was found to be specific.
5. Robustness
Table 9 Results of Robustness Studies
Sr.
Amount Taken
Retention
Area of
% Amount
Samples
Condition
No
[µg/mL]
Time
Peaks
Found
ATN
CTN
ATN CTN ATN CTN
ATN
CTN
Flow rate (<0.2
1
Robustness 1
80
20
2.31
3.5
7179 3737
99.7
99.5
mL/min)
2
Robustness 2 Wavelength(<2.0 nm)
80
20
2.34
3.54
7236 3746
100.2 100.5
7207. 3741.
2.32
3.52
100
100
Mean
5
5
0.02
0.02
40.3
6.36
0.35
0.70
SD
0.91
0.80
0.5
0.17
0.35
0.70
%RSD
17
International Journal of Advances in Pharmaceutics 3 (1) 2014
Figure 14 Chromatogram of Robustness (<2.0 nm)
Figure 15 Chromatogram of Robustness (<0.2mL/min)
The results of assay of test solution were not affected by varying the conditions. They fully agree with the results obtained
under original conditions. The % RSD for (Retention time, Peak area and % Amount Found) is not more than 2% for
both (ATN & CTN) which is in agreement with system suitability. Hence the proposed HPLC method for the determination
of ATN and CTN in a tablet was found to be robust.
6. Ruggedness
Table 10 Results of Ruggedness Studies
% Amount Found
Sr.
Amount Taken [µg/mL]
Intra-Day
Inter-Day
Different Analyst
No
ATN
CTN
ATN
CTN
ATN
ATN
ATN
CTN
1
80
20
99.88
99.5
100.25
99.5
99.8
100
2
80
20
100.3
100.5
100.43
99
100.2
101
3
80
20
100.6
101.5
100.37
101
100.0
100.5
Mean
100.3
100.5
100.35
99.8
100
100.5
SD
0.375
1
0.09
1.04
0.265
0.70
%RSD
0.374
0.9
0.095
1.042
0.56
0.72
The mean % amount found for (ATN & CTN) by different analyst was found to be 100% (ATN) and
100.5%(CTN) also the % RSD values for (Intra-Day, Inter-Day and Different analyst) studies for both the drugs is not
more than 2% for both (ATN & CTN) which is agreement with system suitability hence the proposed HPLC method for the
determination of ATN and CTN in a tablet was found to be rugged.
International Journal of Advances in Pharmaceutics 3 (1) 2014
18
4. Conclusion
The developed RP-HPLC method was found to be simple, accurate, sensitive, precise, specific, economical and
rapid. The developed RP-HPLC method shows the good resolution between ATN and CTN within the run time of 20 min.
The developed RP-HPLC method is very simple involving no complicated sample preparations. The developed RP-HPLC
method was found to be highly specific. The developed RP-HPLC method was found to be linear over wider concentration
range. Therefore the developed RP-HPLC method can be applied for routine quantitative and qualitative analysis of ATN
and CTN in bulk and pharmaceutical formulations like tablets. The developed RP-HPLC method was validated as per the
ICH guidelines.
References
1. Vibha Gupta et al. Development and validation of HPLC method- a review. Int. Res. J Pharm. App Sci 2012; 2(4): 1725.
2. International Conferences on Harmonization Q2 (R1), Validation of Analytical Procedures: Text and Methodology, 2005,
pp. 101-109.
3. ICH-Q1A (R2): Stability Testing of New Drug Substances and Products (Second Revision), FDA, Vol. 68, 2003,pp. 225,
657-678.
4. ICH-Q1B: Photostability Testing of New Drug Sub-stances and Products, FDA, Vol. 62, No. 95, 1997, pp.27115-27122.
5. Indian Pharmacopoeia, Government of India, Ministry of Health and Family Welfare. New Delhi; Published by the
Controller of Publications; (2010), Vol.2, pp. 129.
6. Indian Pharmacopoeia, Government of India, Ministry of Health and Family Welfare. New Delhi; Published by the
Controller of Publications; (2010), Vol.2, pp. 310.
7. Belal F et al. Stability-indicating HPLC Method for the Determination of Atenolol in Pharmaceutical Preparations. J
Chromat Separation Techniq 2013; 4(1): 1-7.
8. Youssef RM et al. Validated Stability Indicating Methods for the Simultaneous determination of Amloride
Hydrochloride, Atenolol and Chlorthalidone Using HPTLC and HPLC with Photodiode Array Detector. J AOAC Int
2013; 96(2): 313-323.
9. Chetta N. et al. Development and Validation of a Stability Indicating High Performance Liquid Chromatographic
(HPLC) Method for Atenolol and Hydrochlorothiazide in Bulk Drug and Tablet Formulation. Int J Chem Tech Res
2013;1(3): 654-662.
10. Kumar GS et al. Development and Validation of RP-HPLC Method for Simultaneous Estimation of Atenolol and
Chlorthalidone in Bulk and Dosage Form. Int Res j Pharma 2013; 3(10): 215-19.
11. Abdelwahab S. et al. Determination of Atenolol, Chlorthalidone and their degradation products by TLC-Densitometric
and Chemometric Method, J Adv Chem Sci 2010; 4(1): 200-210.
12. Nivedita G. et al. Simultaneous Estimation of Atenolol and Chlorthalidone as Bulk and in Tablet Dosage form by UvSpectrophotometry. IOSR Journal of Pharmacy and Biological Sciences 2012; 1(4):20-23.
13. Pawar PY.et al. Simultaneous Estimation of Amlodipine Besylate and Atenolol in Combined Dosage Form by Vierodt’s
Method Using U.V. Spectroscopy. Scholars Research Library 2013; 5(2): 97-102.
14. Tulija Rani G et al. A Validated RP-HPLC method for the Simultaneous Estimation of Atenolol and Indapamide in
Pharmaceutical Formulations. Journal of Chemistry 2011; 8: 1238-1245.
15. Brijesh Singh et al. Development of RP-HPLC Method for the Determination of Chlorthalidone in Pharmaceutical
Dosage Form. International Journal of Pharmacy and Pharmaceutical Sciences 2009; 1: 43-45.
16. Raval HV et al. Estimation of Metoprolol Tartarate and Chlorthalidone in Combine Dosage Form by UV
Spectrophotometric methods. Research Journal of Pharmacy and Technology 2011; 04: 1132.
17. Jitendra Kumar et al. Recent Approaches for Impurity Profiling of Pharmaceuticals. International Journal of Advances in
Pharmaceutics 2013; 2(3): 25-34.
18. Abhijeet Welankiwar et al. Photostability Testing of Pharmaceutical Products. Int Res J Pharm 2013; 4(9): 11-15.
19. www.drugbank.ca/DB00335/Atenolol.
20. www.drugbank.ca/DB00310/Chlorthalidone
