Slide 2
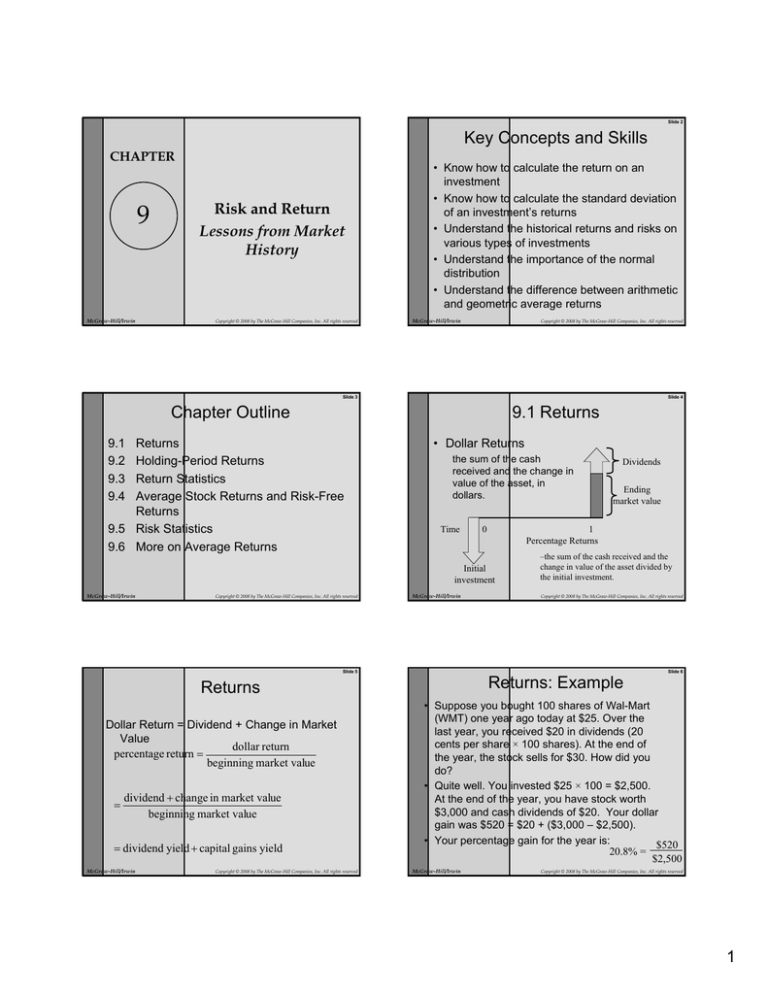
Key Concepts and Skills
CHAPTER
9
McGraw-Hill/Irwin
Risk and Return
Lessons from Market
History
Copyright © 2008 by The McGraw-Hill Companies, Inc. All rights reserved
• Know how to calculate the return on an
investment
• Know how to calculate the standard deviation
of an investment’s returns
• Understand the historical returns and risks on
various types of investments
• Understand the importance of the normal
distribution
• Understand the difference between arithmetic
and geometric average returns
McGraw-Hill/Irwin
Copyright © 2008 by The McGraw-Hill Companies, Inc. All rights reserved
Slide 3
Slide 4
Chapter Outline
9.1 Returns
9.1
9.2
9.3
9.4
Returns
Holding-Period Returns
Return Statistics
Average Stock Returns and Risk-Free
Returns
9.5 Risk Statistics
9.6 More on Average Returns
• Dollar Returns
the sum of the cash
received and the change in
value of the asset, in
dollars.
Time
0
Copyright © 2008 by The McGraw-Hill Companies, Inc. All rights reserved
McGraw-Hill/Irwin
Ending
market value
1
Percentage Returns
Initial
investment
McGraw-Hill/Irwin
Dividends
–the sum of the cash received and the
change in value of the asset divided by
the initial investment.
Copyright © 2008 by The McGraw-Hill Companies, Inc. All rights reserved
Slide 5
Slide 6
Returns: Example
Returns
Dollar Return = Dividend + Change in Market
Value
dollar return
percentage return =
beginning market value
=
dividend + change in market value
beginning market value
= dividend yield + capital gains yield
McGraw-Hill/Irwin
Copyright © 2008 by The McGraw-Hill Companies, Inc. All rights reserved
• Suppose you bought 100 shares of Wal-Mart
(WMT) one year ago today at $25. Over the
last year, you received $20 in dividends (20
cents per share × 100 shares). At the end of
the year, the stock sells for $30. How did you
do?
• Quite well. You invested $25 × 100 = $2,500.
At the end of the year, you have stock worth
$3,000 and cash dividends of $20. Your dollar
gain was $520 = $20 + ($3,000 – $2,500).
• Your percentage gain for the year is:
$520
20.8% =
$2,500
McGraw-Hill/Irwin
Copyright © 2008 by The McGraw-Hill Companies, Inc. All rights reserved
1
Slide 7
Slide 8
Returns: Example
9.2 Holding Period Returns
Dollar Return:
$520 gain
• The holding period return is the return
that an investor would get when
holding an investment over a period
of n years, when the return during
year i is given as ri:
$20
$3,000
Time
0
1
Percentage Return:
20.8% =
-$2,500
McGraw-Hill/Irwin
holding period return =
= (1 + r1 ) × (1 + r2 ) × "× (1 + rn ) − 1
$520
$2,500
Copyright © 2008 by The McGraw-Hill Companies, Inc. All rights reserved
McGraw-Hill/Irwin
Slide 9
Year Return
1
10%
2
-5%
3
20%
4
15%
Your holding period return =
= (1 + r1 ) × (1 + r2 ) × (1 + r3 ) × (1 + r4 ) − 1
= (1.10) × (.95) × (1.20) × (1.15) − 1
= .4421 = 44.21%
McGraw-Hill/Irwin
Copyright © 2008 by The McGraw-Hill Companies, Inc. All rights reserved
Slide 10
Holding Period Returns
Holding Period Return: Example
• Suppose your investment provides
the following returns over a four-year
period:
Copyright © 2008 by The McGraw-Hill Companies, Inc. All rights reserved
• A famous set of studies dealing with rates of
returns on common stocks, bonds, and Treasury
bills was conducted by Roger Ibbotson and Rex
Sinquefield.
• They present year-by-year historical rates of
return starting in 1926 for the following five
important types of financial instruments in the
United States:
–
–
–
–
–
Large-company Common Stocks
Small-company Common Stocks
Long-term Corporate Bonds
Long-term U.S. Government Bonds
U.S. Treasury Bills
McGraw-Hill/Irwin
Copyright © 2008 by The McGraw-Hill Companies, Inc. All rights reserved
Slide 11
9.3 Return Statistics
• The history of capital market returns can be
summarized by describing the:
– average return
( R + " + RT )
R= 1
T
– the standard deviation of those returns
( R1 − R ) 2 + ( R2 − R ) 2 + " ( RT − R ) 2
SD = VAR =
T −1
Slide 12
Historical Returns, 1926-2004
Series
Average
Annual Return
Standard
Deviation
Large Company Stocks
12.3%
20.2%
Small Company Stocks
17.4
32.9
Long-Term Corporate Bonds
6.2
8.5
Long-Term Government Bonds
5.8
9.2
U.S. Treasury Bills
3.8
3.1
Inflation
3.1
4.3
– 90%
– the frequency distribution of the returns
Distribution
0%
+ 90%
Source: © Stocks, Bonds, Bills, and Inflation 2006 Yearbook™, Ibbotson Associates, Inc., Chicago (annually updates work by
Roger G. Ibbotson and Rex A. Sinquefield). All rights reserved.
McGraw-Hill/Irwin
Copyright © 2008 by The McGraw-Hill Companies, Inc. All rights reserved
McGraw-Hill/Irwin
Copyright © 2008 by The McGraw-Hill Companies, Inc. All rights reserved
2
Slide 13
Slide 14
9.4 Average Stock Returns and Risk-Free
Returns
Risk Premia
• The Risk Premium is the added return (over and
above the risk-free rate) resulting from bearing risk.
• One of the most significant observations of stock
market data is the long-run excess of stock return
over the risk-free return.
• Suppose that The Wall Street Journal
announced that the current rate for one-year
Treasury bills is 5%.
• What is the expected return on the market of
small-company stocks?
• Recall that the average excess return on small
company common stocks for the period 1926
through 2005 was 13.6%.
• Given a risk-free rate of 5%, we have an
expected return on the market of small-company
stocks of 18.6% = 13.6% + 5%
– The average excess return from large company common
stocks for the period 1926 through 2005 was:
8.5% = 12.3% – 3.8%
– The average excess return from small company common
stocks for the period 1926 through 2005 was:
13.6% = 17.4% – 3.8%
– The average excess return from long-term corporate
bonds for the period 1926 through 2005 was:
2.4% = 6.2% – 3.8%
McGraw-Hill/Irwin
Copyright © 2008 by The McGraw-Hill Companies, Inc. All rights reserved
McGraw-Hill/Irwin
Copyright © 2008 by The McGraw-Hill Companies, Inc. All rights reserved
Slide 15
Slide 16
The Risk-Return Tradeoff
9.5 Risk Statistics
• There is no universally agreed-upon
definition of risk.
• The measures of risk that we discuss
are variance and standard deviation.
18%
Small-Company Stocks
Annual Return Average
16%
14%
Large-Company Stocks
12%
10%
8%
– The standard deviation is the standard
statistical measure of the spread of a sample,
and it will be the measure we use most of this
time.
– Its interpretation is facilitated by a discussion
of the normal distribution.
6%
T-Bonds
4%
T-Bills
2%
0%
5%
10%
15%
20%
25%
30%
35%
Annual Return Standard Deviation
McGraw-Hill/Irwin
Copyright © 2008 by The McGraw-Hill Companies, Inc. All rights reserved
McGraw-Hill/Irwin
Copyright © 2008 by The McGraw-Hill Companies, Inc. All rights reserved
Slide 17
Slide 18
Normal Distribution
• A large enough sample drawn from a
normal distribution looks like a bell-shaped
curve.
Probability
The probability that a yearly return
will fall within 20.2 percent of the
mean of 12.3 percent will be
approximately 2/3.
– 3σ
– 48.3%
– 2σ
– 28.1%
– 1σ
– 7.9%
0
12.3%
+ 1σ
32.5%
68.26%
+ 2σ
52.7%
+ 3σ
72.9%
Return on
large company common
stocks
95.44%
99.74%
McGraw-Hill/Irwin
Copyright © 2008 by The McGraw-Hill Companies, Inc. All rights reserved
Normal Distribution
• The 20.2% standard deviation we
found for large stock returns from
1926 through 2005 can now be
interpreted in the following way: if
stock returns are approximately
normally distributed, the probability
that a yearly return will fall within 20.2
percent of the mean of 12.3% will be
approximately 2/3.
McGraw-Hill/Irwin
Copyright © 2008 by The McGraw-Hill Companies, Inc. All rights reserved
3
Slide 19
Example – Return and Variance
Year
Actual
Return
Average
Return
Deviation from
the Mean
1
.15
.105
.045
.002025
.09
.105
-.015
.000225
3
.06
.105
-.045
.002025
4
.12
.105
.015
.000225
.00
.0045
Totals
Variance = .0045 / (4-1) = .0015
McGraw-Hill/Irwin
9.6 More on Average Returns
• Arithmetic average – return earned in an
average period over multiple periods
• Geometric average – average compound return
per period over multiple periods
• The geometric average will be less than the
arithmetic average unless all the returns are
equal.
• Which is better?
Squared
Deviation
2
Slide 20
Standard Deviation = .03873
Copyright © 2008 by The McGraw-Hill Companies, Inc. All rights reserved
– The arithmetic average is overly optimistic for long
horizons.
– The geometric average is overly pessimistic for short
horizons.
McGraw-Hill/Irwin
Copyright © 2008 by The McGraw-Hill Companies, Inc. All rights reserved
Slide 21
Geometric Return: Example
Slide 22
Geometric Return: Example
• Recall our earlier example:
Year Return Geometric average return =
1
10% (1 + r ) 4 = (1 + r ) × (1 + r ) × (1 + r ) × (1 + r )
1
2
3
4
g
2
-5%
4 (1.10) × (.95) × (1.20) × (1.15) − 1
=
r
g
3
20%
4
15% = .095844 = 9.58%
So, our investor made an average of 9.58% per year,
realizing a holding period return of 44.21%.
• Note that the geometric average is
not the same as the arithmetic
average:
Year Return
r1 + r2 + r3 + r4
1
10% Arithmetic average return =
4
2
-5%
3
20% = 10% − 5% + 20% + 15% = 10%
4
4
15%
1.4421 = (1.095844) 4
McGraw-Hill/Irwin
Copyright © 2008 by The McGraw-Hill Companies, Inc. All rights reserved
McGraw-Hill/Irwin
Copyright © 2008 by The McGraw-Hill Companies, Inc. All rights reserved
Slide 23
Slide 24
Forecasting Return
• To address the time relation in forecasting
returns, use Blume’s formula:
⎛ N −T ⎞
⎛ T −1 ⎞
R (T ) = ⎜
⎟ × Arithmetic Average
⎟ × GeometricA verage + ⎜
⎝ N −1 ⎠
⎝ N −1⎠
where, T is the forecast horizon and N is the number of
years of historical data we are working with. T must be
less than N.
McGraw-Hill/Irwin
Copyright © 2008 by The McGraw-Hill Companies, Inc. All rights reserved
Quick Quiz
• Which of the investments discussed has
had the highest average return and risk
premium?
• Which of the investments discussed has
had the highest standard deviation?
• Why is the normal distribution informative?
• What is the difference between arithmetic
and geometric averages?
McGraw-Hill/Irwin
Copyright © 2008 by The McGraw-Hill Companies, Inc. All rights reserved
4
Slide 25
Contact Information
• Office: RCOB 18, U of West Georgia
• Office Phone and Voicemail: (770)3018648 (cell) or (678)839-4816 (office)
• Class Webpage: Ulearn/WEBCT Vista
• E-mail: Ulearn/WEBCT Vista (pref.) or
chodges@westga.edu (alt.)
• MSN Instant Messenger:
mba8622@hotmail.com
McGraw-Hill/Irwin
Copyright © 2008 by The McGraw-Hill Companies, Inc. All rights reserved
5


