Newton Abbot JSNA Profile 07
advertisement
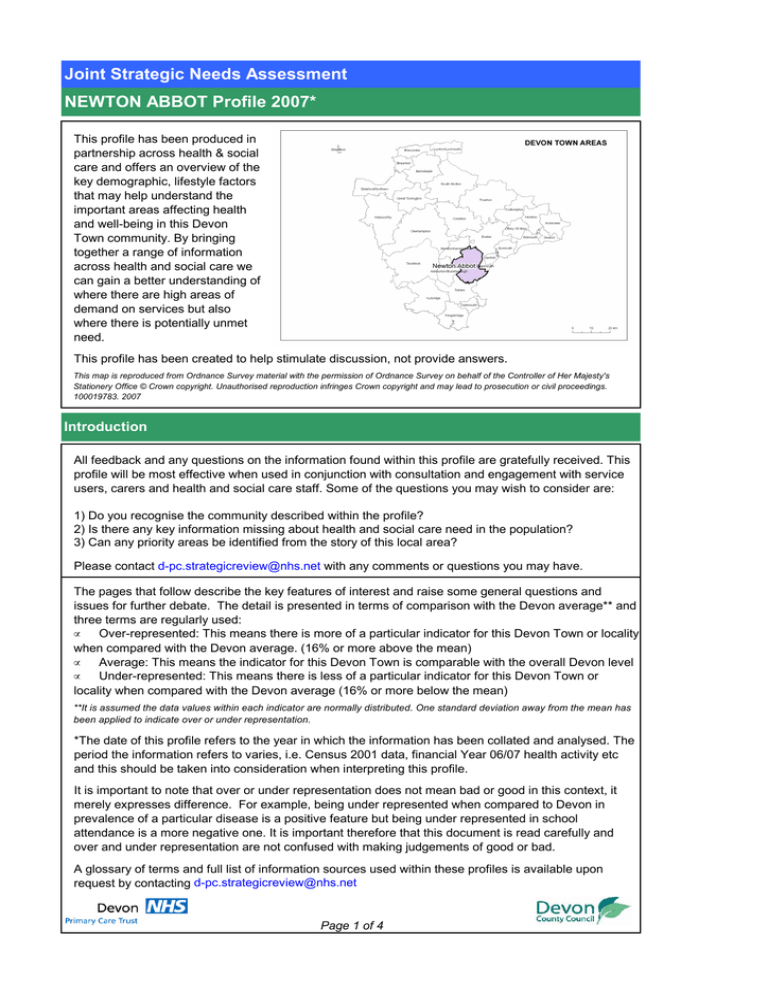
Joint Strategic Needs Assessment NEWTON ABBOT Profile 2007* This profile has been produced in partnership across health & social care and offers an overview of the key demographic, lifestyle factors that may help understand the important areas affecting health and well-being in this Devon Town community. By bringing together a range of information across health and social care we can gain a better understanding of where there are high areas of demand on services but also where there is potentially unmet need. This profile has been created to help stimulate discussion, not provide answers. This map is reproduced from Ordnance Survey material with the permission of Ordnance Survey on behalf of the Controller of Her Majesty's Stationery Office © Crown copyright. Unauthorised reproduction infringes Crown copyright and may lead to prosecution or civil proceedings. 100019783. 2007 Introduction All feedback and any questions on the information found within this profile are gratefully received. This profile will be most effective when used in conjunction with consultation and engagement with service users, carers and health and social care staff. Some of the questions you may wish to consider are: 1) Do you recognise the community described within the profile? 2) Is there any key information missing about health and social care need in the population? 3) Can any priority areas be identified from the story of this local area? Please contact d-pc.strategicreview@nhs.net with any comments or questions you may have. The pages that follow describe the key features of interest and raise some general questions and issues for further debate. The detail is presented in terms of comparison with the Devon average** and three terms are regularly used: • Over-represented: This means there is more of a particular indicator for this Devon Town or locality when compared with the Devon average. (16% or more above the mean) • Average: This means the indicator for this Devon Town is comparable with the overall Devon level • Under-represented: This means there is less of a particular indicator for this Devon Town or locality when compared with the Devon average (16% or more below the mean) **It is assumed the data values within each indicator are normally distributed. One standard deviation away from the mean has been applied to indicate over or under representation. *The date of this profile refers to the year in which the information has been collated and analysed. The period the information refers to varies, i.e. Census 2001 data, financial Year 06/07 health activity etc and this should be taken into consideration when interpreting this profile. It is important to note that over or under representation does not mean bad or good in this context, it merely expresses difference. For example, being under represented when compared to Devon in prevalence of a particular disease is a positive feature but being under represented in school attendance is a more negative one. It is important therefore that this document is read carefully and over and under representation are not confused with making judgements of good or bad. A glossary of terms and full list of information sources used within these profiles is available upon request by contacting d-pc.strategicreview@nhs.net Page 1 of 4 What do we know about Newton Abbot? (When compared to the Devon average) Population Profile Newton Abbot Projected Population - Proportion by Age Band 0% 10% 20% 30% 40% 2006 21.3% 2011 20.1% 2016 19.2% 29.2% 2021 18.7% 29.1% 50% 60% 31.4% 80% 27.7% 30.2% 0-17 70% 29.0% 29.0% 45-64 65-84 100% 16.9% 2.7% 17.6% 3.1% 19.3% 28.3% 18-44 90% 20.3% 3.3% 3.6% 85+ · In 2006 the population profile of Newton Abbot is in line with the Devon average · Population projections to 2021 also show a percentage change in the population which is in line with the Devon average · By 2021 there is a predicted overall population increase of 13% · The largest population change is predicted in the elderly population aged 85 and over with an expected increase of 49% Areas of Interest · Over representation of owner occupied homes; the highest level in the Teignbridge district · Newton Abbot has the second highest percentage of children from a ethnic minority group · Over representation of females committing offences (district level) · High number of children with statements or registered with school action plus · Over representation of children placed with specialist foster carers · Newton Abbot schools have: - Over representation of permanent school exclusions - Over representation of those eligible and take up of free school meals - The second highest number of children with Special Educational Needs of any Devon Town Page 2 of 4 What do we know about Newton Abbot? (When compared to the Devon average) Indices of Multiple Deprivation - Index of Multiple Deprivation - overall index of the seven main subdomains (listed below) Income - Measure of persons on low incomes or dependent on state benefits Employment - Measure of persons of working-age who are involuntarily excluded from labour market Health - Measure of premature death, illness, hospital admissions and mental health prescribing Education - Measure of educational attainment in children and skills and qualifications of adults Barriers - Measure of distance to community facilities (GP, school etc.) and housing availability Crime - Measure of recorded crime (burglary, theft, criminal damage and violence) Living Env - Measure of indoor (quality of housing) and outdoor (RTAs and air quality) environments 10.22 11.3 10.91 Ivybridge Sidmouth 13 Moret 11.38 Cullompton Seaton 14.26 13.93 Exmouth 15 Braunton 15.41 14.85 Kingsbridge 15.59 15.47 Tavistock Honiton Axminster 16.43 15.91 N Abbott 16.85 16.62 Crediton Dartmouth 17.32 G Torr 17.27 Okehampton Totnes 19.06 18.73 Exeter Lynt / Lynm 19.37 19.31 South Molton 19.83 19.64 Tiverton Teignmouth Ash / Buck 19.9 19.87 20 Barnstaple 21.15 25 20.73 22.07 30 26.81 Indices of Deprivation 2007 - Average IMD Scores by Devon Town (A higher score represents a greater level of deprivation) 10 5 Ottery Dawlish Holsworthy Bideford/Northam Ilfracombe 0 The Indices of Deprivation are reported on a small geography called Lower Super Output Areas (LSOA). These have been aggregated up to the Devon Town geography to allow for comparison between areas within Devon. The result of this is that the average score at a Devon Town level may mask neighbourhoods that the indices suggest are the most / least deprived. Newton Abbot has 46 LSOA's, of which 1 is in the most deprived quintile of LSOA's nationally and 7 are in the least deprived quintile. Health and Social Care HEALTH · Age standardised death rates are in line with the Devon average with the exception of Suicide / Injuries which is under represented · GP registers information is under represented in Mental Health, Heart Failure and COPD · Second lowest registered rate of COPD Devon and lowest rate in the Teignbridge district · Over representation in Cervical Screening rates; the highest rate in the Teignbridge district · The Newton Abbot population is: - Over represented in the use of A&E services - Over represented in new Outpatient appointments on community hospitals - Over represented in follow-up Outpatient appointments in both community and acute hospitals - Over represented in Day Attender rates in community hospitals - Under represented in Non-Elective admissions; the lowest rate in the Teignbridge district - Over represented in Mother & Baby into acute hospitals; the highest rate in the Teignbridge district Page 3 of 4 Health and Social Care Limiting Long Term Illness Standardised Rate by Devon Town, 2001 Census SMR Eng & Wales Standardised Rate 120.0 100.0 80.0 60.0 40.0 20.0 Devon Totnes Tiverton Teignmouth S Molton Tavistock Sidmouth Ottery Seaton Okehampton Moret N Abbott Lynt / Lynm Ivybridge Kingsbridge Honiton Ilfracombe G Torr Holsworthy Exeter Exmouth Dawlish Dartmouth Crediton Cullompton Bideford Braunton Axminster Barnstaple Ash / Buck 0.0 The chart above displays rates of self-report limiting long-term illness from the 2001 Census adjusted for age. A value of 100 represented by the line in the chart is the England & Wales average, and the bars represent rates for Devon Towns. This reveals that Newton Abbot is below the national average, but slightly above the Devon average. SOCIAL CARE - Children’s & Young Persons (CYPS) and Adult & Community Services (ACS) · Over representation in the rate of referrals into ACS, particularly regarding the 65 and over population where the second highest rate of any Devon Town is seen · Over represented in the proportion of referrals into ACS that are dealt with at point of contact for clients aged 65 and over, i.e. signposting / providing a basic service one-off service as opposed to referring for a further assessment of need which may result in commissioning an on-going service Referral Rate Referrals into Adult & Community Services (during 2006/07) Rate per 1000/18+ Population Devon 60.0 40.0 30.0 20.0 10.0 Page 4 of 4 Totnes Tiverton Tavistock Teignmouth S Molton Seaton Sidmouth Ottery Okehampton N Abbott Moret Lynt / Lynm Kingsbridge Ivybridge Honiton Ilfracombe G Torr Holsworthy Exmouth Exeter Dawlish Dartmouth Crediton Cullompton Braunton Bideford/Northam Axminster Barnstaple 0.0 Ash / Buck Referral Rate 50.0

