Applications - Syscomp Electronic Design
advertisement
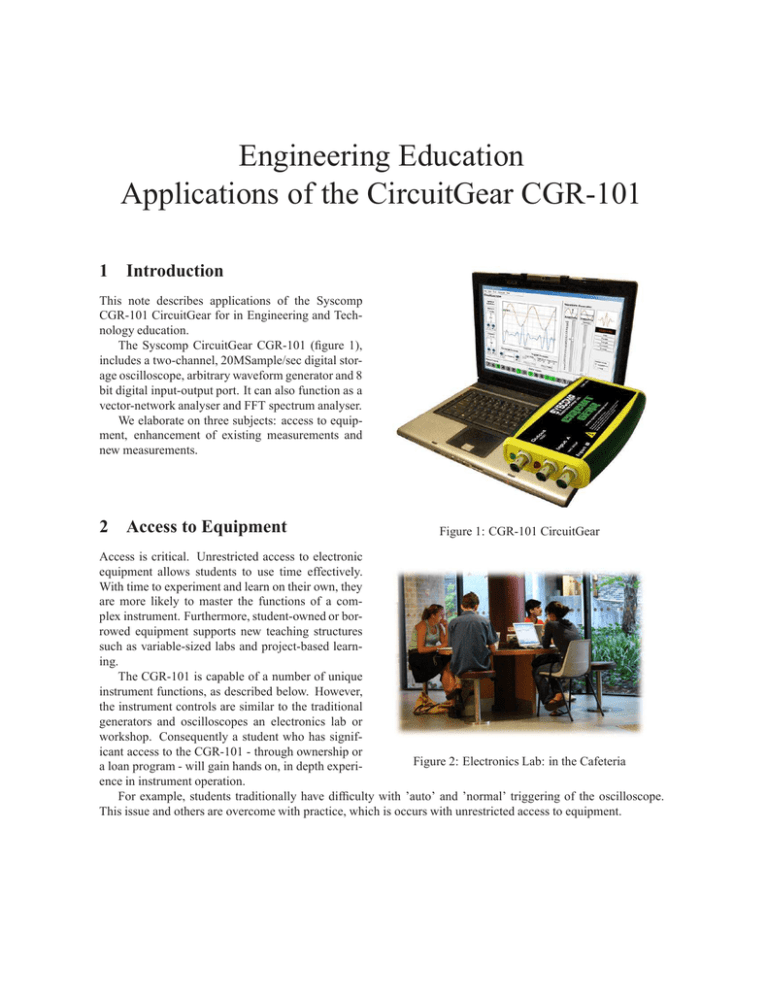
Engineering Education Applications of the CircuitGear CGR-101 1 Introduction This note describes applications of the Syscomp CGR-101 CircuitGear for in Engineering and Technology education. The Syscomp CircuitGear CGR-101 (figure 1), includes a two-channel, 20MSample/sec digital storage oscilloscope, arbitrary waveform generator and 8 bit digital input-output port. It can also function as a vector-network analyser and FFT spectrum analyser. We elaborate on three subjects: access to equipment, enhancement of existing measurements and new measurements. 2 Access to Equipment Figure 1: CGR-101 CircuitGear Access is critical. Unrestricted access to electronic equipment allows students to use time effectively. With time to experiment and learn on their own, they are more likely to master the functions of a complex instrument. Furthermore, student-owned or borrowed equipment supports new teaching structures such as variable-sized labs and project-based learning. The CGR-101 is capable of a number of unique instrument functions, as described below. However, the instrument controls are similar to the traditional generators and oscilloscopes an electronics lab or workshop. Consequently a student who has significant access to the CGR-101 - through ownership or Figure 2: Electronics Lab: in the Cafeteria a loan program - will gain hands on, in depth experience in instrument operation. For example, students traditionally have difficulty with ’auto’ and ’normal’ triggering of the oscilloscope. This issue and others are overcome with practice, which is occurs with unrestricted access to equipment. 3 Enhancement of Measurements 3.1 Routine Measurements Routine measurements such as the period of a waveform are enhanced by measurement cursors, automated readouts and waveform capture. This saves student time and allows focus on the lesson rather than operation of the equiment. Example: It is important to be able to measure a time interval by counting oscilloscope divisions and multiply by a scale factor. However, there is very little learning value in doing that for every measurement. The CGR-101 provides on-screen time cursors to facilitate time measurement. Example: It is time-wasting to hand copy a waveform diagram from the oscilloscope screen into a lab record. With the CGR-101, a student can capture a screen image into a document and paste it into an electronic lab report. 3.2 Transient Waveform Capture and Analysis The CGR-101 digital oscilloscope can capture, display and save transient waveforms. This eliminates the requirement for a stable, repetitive display of some phenomenon and makes it feasible to measure phenomena that are inherently transient in nature, such as: • mechanical switch, contact bounce [12], see figure 3 • magnetic induction, swiping a magnet past a coil • single-shot decay of energy in a resonant circuit Figure 3: Contact Bounce, Relay Closure 3.3 Bode Plots Traditionally, students measure gain and phase by comparing two oscilloscope traces. This is slow and tedious. The CircuitGear signal generator/oscilloscope combination supports vector network analysis over the range 1 Hz to 2MHz. Amplitude and phase plots over that frequency range are completely automatic. It is now feasible to do exercises that are difficult or impossible with manual analysis. For example, one can vary the cutoff frequency in a low pass filter and immediately see the effect on filter gain and phase. Figure 4 shows another example, the gain and phase of a 120Hz notch filter. Automatic measurement of gain and phase allows in-depth exploration of such topics as: • component impedance, magnitude and phase Figure 4: Network Analyser Plot, Notch Filter 2 • passive RC and LRC filter response • Q factor and magnification effect • Response of amplifiers and active filters • Relating time domain and frequency domain behaviour 3.4 Stability Analysis of Feedback System CircuitGear may be used to explore the stability of a feedback system, using the method described in [1]. A variable frequency disturbance is injected into the loop. The Vector Network Analyser automatically plots the gain and phase of the feedback signal. The plot can then be related to the stability of the system. In a separate test, the oscilloscope may be used to relate that stability to behaviour in the time domain by measuring the overshoot and ringing response to a square wave setpoint or disturbance. 4 Waveform Generator Applications The first laboratory signal generators, such as the Hewlett-Packard 200A [3], produced a sine wave. The frequency is tuned manually in one-decade steps. Tuning accuracy is dependent on resistor and capacitor tolerances. In the early 60’s, these were replaced by the function generator, which could operate to lower frequencies, useful in testing electro-mechanical servo systems. A basic function generator produces sine, square and triangle waveforms [4]. Frequency is generally tuned manually in one-decade steps. As in the case of sine wave generators, tuning accuracy is dependent on resistor and capacitor tolerances. The third generation general-purpose lab signal generator is the arbitrary waveform generator (aka AWG). The arbitrary waveform generator is based on direct digital synthesis [5]. As a consequence, the frequency can be set by digital control with sub-hertz resolution and accuracy. The frequency can be swept over the entire frequency range of the instrument. In the case of the CGR-101, the frequency range is 0.1Hz to 2MHz with a resolution of 0.1Hz. The capabilities of the AWG lead to some useful educational applications, as follows: 4.1 Narrow-band Resonance Since the frequency is known precisely and can be adjusted in small steps, it’s possible to explore the resonance curve of a narrow-band device such as a piezoelectric filter or transducer. As knowledge of the resonance curve is refined, the sweep range can be narrowed to the region of interest1 . This same technique is useful for exploring resonance in mechanical structures.. 4.2 Arbitrary Sweep Range The AWG frequency is established by a digital number, so all frequencies are equally accessible. Consequently it is straightforward to sweep frequency – automatically or using manual control – through a large or small range. For example, it is possible to sweep the entire audio range 20Hz to 20kHz, to explore the behaviour of loudspeaker system or active-filter frequency equalizer. 1 CircuitGear is currently used in a commercial application to characterize piezoelectric transducers. 3 4.3 Waveforms for Transfer Function Measurement Transfer function measurements may be explored using a wide variety of pulse shapes, not just the traditional sine, square and triangle. Here are three examples: • Figure 5 shows the response of a network to a ramp input signal. The ramp function requires a three part waveform: ramp, reset and quiescent period [6]. The student or lab instructor can create the waveform using the open-source Wavemaker software [7]. • It is possible to show the behaviour of matched pulse-filter pair. The impulse response of a filter is measured. The impulse waveform is then reversed in time and used as an input to the filter to demonstrate conjugate matching [8]. Figure 5: Response of RC Lowpass filter to Ramp Input • The raised cosine and sinc pulse shapes are important in communications theory. The arbitrary waveform generator can produce those shapes to test hardware filters. 4.4 Biomedical Waveforms Biomedical instruments are an excellent subject for exercises and projects in analog circuit design. These circuits provide challenges in noise control, amplification and filtering. The circuits must be tested with biological waveforms, such as the ECG, EMG or EEG2 . Figure 6 shows an ECG waveform. Once a suitable waveform is identified, it can be transcribed into a data file that can be produced as a waveform from the generator. 5 Noise Generator Applications Figure 6: ECG Waveform A noise test signal has applications in communications theory, instrumentation and acoustics. The CircuitGear noise generator produces a white noise spectrum, that is, the signal has equal energy in a fixed bandwidth, regardless of frequency. (An FFT of the spectrum will be flat, since the frequency bins are equal width.) All voltage values are equally probable, so the probability distribution is rectangular 3 . 2 ECG: electrocardiogram, heart muscle signal. EMG: electromyogram, muscle signal. EEG: electroencephalogram, brain neural signals. CircuitGear noise source is a 32-bit shift register, configured to give a pseudo-randombit sequence, and clocked at 100MHz [9]. Every 8 shift pulses, an 8 bit sample is extracted and converted to analog form. Consequently the noise rate is 12.5M samples/second. The shift register sequence length is 232 shifts before repeating, which gives a repetition period of 42 seconds. 3 The 4 5.1 Statistical Measurements of Noise The CircuitGear noise signal may be used to illustrate such concepts as variance, mean and probability distribution. For example, the probability distribution can be measured with an analog window comparator circuit. The circuit produces an output whenever the input is within the amplitude window. The window is moved to encompass a small range of inputs V to V + δ. The averaged output from the window comparator is a measure of the probability of the signal lying within the voltage window. Alternatively, the determination of probability distribution can be determined by converting the oscilloscope waveform measurement into a histogram plot of the signal amplitude4. In a related exercise, it can be shown that the variance of the low-pass filtered noise signal approaches the mean as the filter cutoff frequency is reduced. 5.2 Signal/Noise in Communications Channel A noisy communications channel may be simulated by adding the CircuitGear noise output to an analog or digital signal. Then it is possible to experiment with various detectors and their effectiveness in extracting the signal from the noise. It can be demonstrated how to tradeoff data rate for signal-noise ratio, as for example required in communicating with distant space probes. 5.3 Acoustic Measurements Pink noise5 is widely used in acoustic measurements for measurement of: • Room reverberation time Pink noise is pumped into a room, using a power amplifier and loudspeaker. The noise is interrupted and the decay of sound in the room recorded, using the CGR-101 oscilloscope in single-shot mode. The rate of decay of the sound is an important property of the room acoustics. • Noise transmission To determine noise transmission, pink noise is produced on one side of a sound barrier and the sound level measured on the other side of the barrier. The spectrum of the transmitted sound is an indication of the effectiveness of the barrier at various frequencies. • Loudspeaker frequency response and directivity. Loudspeaker measurements are complex. A swept frequency sine wave measurement (using the CGR-101 nework analyser) is useful in determining the amplitude response. A pink noise measurement is useful in determining the directivity. If a loudspeaker is directive, a listener will detect changes in the tonality (the spectral content) of a pink noise signal at different angles to the loudspeaker. 4 Real-time histogram display is currently available in the DSO-101 oscilloscope software. On request, Syscomp will port that feature to the CGR-101 graphical user interface. 5 Pink noise has equal noise energy in equal percentage bandwidths. Measured with a constant percentage-bandwidth spectrum analyser (such as a bank of third-octave bandpass filters) the response is flat. Pink noise may be obtained from the CircuitGear white noise signal with a passive 3db/octive low-pass filter. Reference [10] section 2.17.2 shows the schematic of a passive component pink-noise filter. 5 6 Spectrum Analysis CircuitGear includes an arbitrary waveform generator, time-domain oscilloscope and frequency domain spectrum analyser using the FFT6 . This combination of features facilitates exploration of a wide variety of waveform spectrum analysis concepts. CircuitGear can simultaneously show the time-domain and frequency-domain (oscilloscope and spectrum analysis) displays of a signal, so comparisons are straightforward and intuitive. A typical spectrum display is shown in figure 7. Subject areas can include: • Examining the spectra of typical waveforms • Effect of waveform parameters (eg, duty cycle, rise time) on spectrum Figure 7: Spectrum Display • Comparison of different types of spectrum analysis, such as Discrete Fourier Transform and the Fast Fourier Transform • Artifacts of digital spectrum analysis (eg, aliasing, picket fence effect) • Analysis of mechanical vibration, eg, roller bearing noise. 7 Advanced Signal Analysis: Signal Averaging and Correlation The CGR-101 CircuitGear includes a signal WGM−101 source (the waveform generator), a detector Oscillator DSO−101 (the oscilloscope) and mathematical routines. Hardware Oscilloscope Ein Magnitude Hardware These are the building blocks for constructing a Quadrature Correlator ChA Input signal processing system such as a lock-in amEin Phase, Alpha Signal Ein plifier or correlator. As an example, the Vector Network AnalMag G=Eout/Eref Test 90 yser (Bode Plotter) provided with the CGRNetwork Phase G=Theta−Alpha Reference G 101 enhances the signal-noise ratio by correlatOscillator ing the measured output against the input sigOutput Eout Phase, Theta Signal Quadrature Correlator nal [11] and extracting both the amplitude and ChB Eout phase of a network under test, as indicated in Eout Magnitude the block diagram of figure 8. A correlator Software Analysis uses the same functions, so similar software can measure the correlation between two signals. The CGR-101 software is entirely openFigure 8: Network Analyser Block Diagram source and uses the (Tcl/Tk) programming language, which is easy to learn [13]. Instructors and students can use the CGR-101 software as a starting point for construction of special-purpose signal processing instruments. 6 FFT: Fast Fourier Transform, an efficient numerical algorithm for spectrum analysis. 6 8 Curve Tracer The combination of signal generator and oscilloscope XY plot can be used to create a low-power curve tracer. For example, the curve tracer can be used to display the current-voltage characteristic of semiconductor devices. Figure 9 shows the VI characteristic of a point-contact diode. Reference [2] describes a curve tracer using a variable voltage transformer to provide the voltage sweep. For a modest sweep voltage and current, the CircuitGear CGR-101 built-in oscillator can be used instead7 . Figure 9: Horizontal: 200mV/div. Vertical: 16.6 mA/div. 9 Logic Port Figure 10: Logic Port Controls CircuitGear includes an 8 bit digital output port and corresponding 8 bit digital input port, figure 10. The outputs are set and cleared from GUI (graphical user interface) switches. Inputs are shown on GUI indicators. A separate interrupt input, sets a software flag. A separate PWM (pulse width modulation) output produces a variable duty cycle pulse waveform at various spot frequencies. • Hardware Replacement It is common in introductory digital electronics for students to use a set of switches to provide digital inputs to a test circuit. A corresponding set of LEDs indicates outputs. The CircuitGear digital input output ports remove the necessity for switch and display hardware. • Experiment Control The switch outputs can be used to control an experiment. For example, the switches could be used to control the centre frequency of a voltage-controlled bandpass filter, while plotting the amplitude and phase response with the vector network analyser. In another example, the switches could be used to control the divide ratio of an electronic counter while observing the counter waveform. • Power Supply Modulator The digital PWM output is useful in operating the electronic switch of a power supply. For example, a digital control program could use the CircuitGear PWM output to produce a variable DC output voltage, while closing the loop with the oscilloscope input as a sensor. 7 The oscillator signal is floated by means of a small transformer. 7 10 Conclusion CircuitGear is a portable, affordable instrument with many features applicable to engineering engineering exercises and projects. Many of these features – spectrum analysis, noise generation, vector network analysis – open up interesting new possibilities for teaching and lab work. Contact Peter D. Hiscocks, Syscomp Electronic Design Limited Email: syscomp-support@magma.ca Web: www.syscompdesign.com July 3, 2009 References [1] How to measure the loop transfer function of power supplies Frederik Dostal, National Semiconductor Application Note 1889, October 2008 http://www.national.com/an/AN/AN-1889.pdf [2] Low Cost Curve Tracer uses PC-Based Scope Peter Hiscocks, James Gaston http://www.syscompdesign.com/curve-tracer.pdf [3] http://www.hp.com/hpinfo/abouthp/histnfacts/museum/earlyinstruments/ 0002/0002history.html [4] http://www.hpmemory.org/wb_pages/wall_b_page_10c.htm [5] MT-085 TUTORIAL, Fundamentals of Direct Digital Synthesis (DDS) Analog Devices, 2009 http://www.analog.com/static/imported-files/tutorials/MT-085.pdf [6] A Laplace Transform Cookbook Peter Hiscocks, March 2008 http://www.syscompdesign.com/laplace-cookbook.pdf [7] Wavemaker software http://www.syscompdesign.com/wavemaker-0.91.zip [8] Matched filtering and timing recovery in digital receivers Louis Litwin RF Design Magazine, September 2001 http://mobiledevdesign.com/images/archive/0901Litwin32.pdf [9] Wikipedia: Linear feedback shift register http://en.wikipedia.org/wiki/Linear_feedback_shift_register [10] Audio-Radio Handbook, Martin Giles, Editor, National Semiconductor, 1980 [11] A Software-Based Network Analyzer Peter Hiscocks, James Gaston, June 2006 http://www.syscompdesign.com/na-theory.pdf 8 [12] Single-Shot Capture Using the DSO-101 Oscilloscope: Measurements on a Relay Peter Hiscocks, James Gaston, September 2006 http://www.syscompdesign.com/relay-demo.pdf [13] Hello Button An Introduction to Tcl/Tk Peter Hiscocks, James Gaston, April 2007 http://www.syscompdesign.com/tcl-intro.pdf 9
