2 0 16
Investment Directions
SEPTEMBER 2016
Entering the Homestretch to the U.S. Election
Judging by the frequency of questions we are asked these days about the
implications of the upcoming U.S. election, it has become top of mind for many—
if not most—investors. And for good reason: To say the least, this has been an
unusual election in the United States and regardless of which candidate you
support, we can all agree that the November election will be historic in many
ways. With the election now entering the homestretch, the market will be closely
following the political machinations in the United States.
Looking Beyond the Cycle
The long-term implications of either Hillary Clinton or Donald Trump winning will likely
have less of an impact on the market than many investors are anticipating. If history is
any guide, election results have had a relatively minimal impact on longer-term U.S. or
global equity returns. What matters more: Growth, earnings, interest rates, inflation—
and how Federal Reserve (Fed) policy responds to all of those.
Swing States
Should it occur, volatility is likely to persist across the broad market, but specific sectors
may be particularly vulnerable or, conversely, offer some opportunity. Among those to be
cautious on is health care. The sector has historically underperformed in election years,
due in large part to concerns over pricing pressure. There could well be longer-term
implications on policy changes, but any significant changes to the health care system
will likely take years. Financials could be affected in a similar fashion.
Counting the Ballots
There are likely still to be many twists and turns ahead in this most curious election,
but a few trends have emerged. Partisanship and gridlock show no signs of ending.
And policies of the next administration will be shaped by rising populist sentiment
in the country, including opposition to global trade, which could be a headwind to
growth. In short, uncertainty and volatility are unlikely to end on November 8.
WHAT’S NEW:
�Upgrade China to (slight)
Overweight – Pg. 6
�Downgrade Municipal Bonds to
Neutral – Pg. 8
�A Bridge to Somewhere? – Pg. 9
Ap
pe
Less R
is k
Vulnerable Incumbents
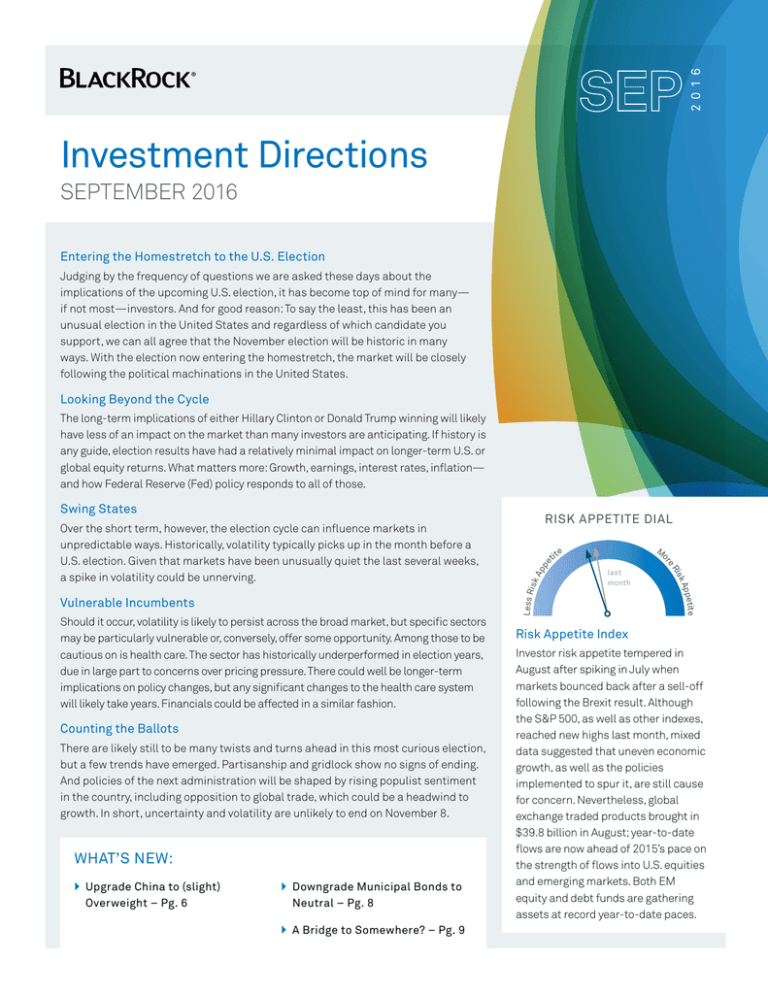
RISK APPETITE DIAL
M
o
e
tit
last
month
etite
App
sk
Ri
re
Over the short term, however, the election cycle can influence markets in
unpredictable ways. Historically, volatility typically picks up in the month before a
U.S. election. Given that markets have been unusually quiet the last several weeks,
a spike in volatility could be unnerving.
Risk Appetite Index
Investor risk appetite tempered in
August after spiking in July when
markets bounced back after a sell-off
following the Brexit result. Although
the S&P 500, as well as other indexes,
reached new highs last month, mixed
data suggested that uneven economic
growth, as well as the policies
implemented to spur it, are still cause
for concern. Nevertheless, global
exchange traded products brought in
$39.8 billion in August; year-to-date
flows are now ahead of 2015’s pace on
the strength of flows into U.S. equities
and emerging markets. Both EM
equity and debt funds are gathering
assets at record year-to-date paces.
United States
Turning Insight Into Action
U.S. economic activity is mixed,
earnings are lackluster and stock
prices remain elevated. Slower Fed
tightening could support the asset
class, but selectivity is important in
the U.S. market, where value will vary
by sector and individual company.
Consider blending opportunities for
core market exposure with highconviction active solutions that focus
on finding value in the market.
C ONSIDER
iShares Core Dividend Growth ETF
(DGRO), iShares Edge MSCI Min Vol
USA ETF (USMV), Basic Value Fund
(MABAX), Global Dividend Fund
(BIBDX), Equity Dividend Fund
(MADVX)
We remain neutral on U.S. equities. U.S. stocks finished the summer again
approaching all-time highs, but autumn brings with it two important events that are
commanding our attention. The first is the contentious U.S. election, which enters its
final stretches with the onset of the debates, and which will be the major focus for
investors for the next couple of months. The second may take longer than the election
cycle to play out, but looms larger over investors’ heads today, and that is, of course, the
actions of the Federal Reserve. The uncertainty brought about by almost weekly
changes in the forecast is causing shifts in the tides for investors.
Macro data continues to ebb and flow. After two consecutive months of flow in monthly
jobs data, the August report provided some ebb, cooling off from the torrid pace set
early in the summer. At the same time, the Institute of Supply Management surveys
have also slowed, putting doubt into investors' minds about the probability of a
September rate hike. Yet Fed officials, including Chair Yellen, have emphasized the
"strengthening" of the case for another rate hike.
When you add all this together, it's clear that uncertainty rules. The experience of 2016
so far has taught us that big periods of multiple expansion, or contraction, have
followed the establishment of some degree of certainty, like the first rate hike or the
Brexit vote. Going forward, this means that the recent range-bound regime may not
change until we receive further clarity from the election and the Fed's next move, which
could come as soon as the end of the month. Meanwhile, as we’ve long emphasized,
without earnings growth, we favor companies with healthy balance sheets (profitable,
consistent and light on leverage) and dividend growers.
EQUITY VOLATILITY AROUND U.S. ELECTIONS
1992-2016
30
Election
VIX LEVEL
25
20
15
10
120
90
60
30
0
30
60
DAYS BEFORE/AFTER ELECTION
High - Low Range
Average
2016
Sources: BlackRock Investment Institute, Bloomberg.
Notes: Chart shows the VIX before and after the November presidential elections from 1992-2012, excluding 2008
due to its outlier status.
[2]
BB LL AA CC KK RR OO CC KK II N
N VV EE SS TT M
M EE N
N TT D
D II RR EE CC TT II OO N
N SS
International Developed Markets
We remain underweight European equities. The latest PMI data in the euro
area suggest contained contagion from the Brexit vote in the United Kingdom.
However, the outlook for the region remains uncertain. For example, the latest
ZEW and Ifo surveys from Germany have pointed in different directions in terms of
investors’ take on the region’s outlook. Both inflation and inflation expectations
also continue their weak trend. The European Central Bank is expected to take
further action, although the lack of immediate negative spillover from the United
Kingdom has likely bought the governing council time. While it is highly likely that
it would need to extend its QE program, the actual timing of the announcement
may well be later this year.
EUROPE: EXPECTATIONS OF GROWTH TICKED UP WHILE
BUSINESS EXPECTATIONS SLIPPED
110
80
105
40
100
0
95
-40
90
-80
85
2/12
8/12
2/13
8/13
2/14
ZEW Expectation of Economic Growth (LHS)
8/14
2/15
8/15
2/16
8/16
Ifo Business Expectations (RHS)
Source: Bloomberg, as of 8/31/16.
SEP T EMBER [3]
Turning Insight Into Action
Selectivity is key. Consider using an
active manager with strong stock
selection expertise or be selective
with index-based exposures.
C ONSIDER
Global Long/Short Equity Fund
(BDMIX), Global Dividend Fund
(BIBDX), Global Allocation Fund
(MALOX), iShares MSCI Canada ETF
(EWC), iShares Edge MSCI Min Vol
Europe ETF (EUMV), iShares
International Select Dividend ETF (IDV)
We remain neutral on Japanese stocks. Confusion in the Japanese market remains
a central theme for 2016. A sharp sector rotation in August has seen cyclical
stocks, particularly financials, rally without much of an improvement in data to
support the rotation. The Bank of Japan (BoJ) is quickly becoming the largest
shareholder in the Nikkei 225, driving performance differences between local
indexes. BoJ Governor Haruhiko Kuroda used his concluding remarks at the
Jackson Hole symposium to emphasize the BoJ will act “without hesitation” and
defend negative rates as a “powerful tool.” Yet speculation of the bank’s purchase
activity at the long end of the Japanese government bond curve, thought to help
steepen the curve for the aid of financial institutions, could backfire without credit
creation. Japanese stocks may need a stronger or more singular catalyst than
central bank action to drive further gains.
JAPAN 10-YEAR JGB YIELD
2.5
2.0
YIELD %
1.5
1.0
0.5
0.0
-0.05
-0.5
1998
2000
2002
2004
2006
2008
2010
2012
Sources: Thomson Reuters Datastream, BlackRock Investment Institute, as of 9/1/16.
[4]
BLACKROCK INVESTMENT DIRECTIONS
2014
2016
We remain cautious toward the United Kingdom. The Bank of England (BoE)
introduced the largest stimulus package since 2009 and cut the base interest rate
by 25 basis points to 0.25%, leaving the door wide open for further cuts this year in
order to fight a potential slowdown of the U.K. economy following the Brexit vote.
The stimulus package included an increase in gilt and corporate bond purchases
and an introduction of the new Term Funding Scheme (TFS), which could support
profitability of commercial banks that could be weighed down by reduction in the
benchmark rate. The BoE stimulus supported U.K. assets on both the equity and
fixed income sides. Meanwhile, U.K. data showed some resilience post the Brexit
vote: The business sentiment dip that we saw in July reversed in August, with both
manufacturing and services PMIs strongly rebounding back into expansion territory.
While the reversal shows that the initial reaction of businesses had been somewhat
overblown, the details around Brexit negotiations are still unclear. Such protracted
uncertainty could weigh on business sentiment as well as investment and hiring
decisions going forward. We continue to prefer U.K. large caps to domestically
oriented small and mid-caps as GBP weakness post the Brexit vote could further
support earnings growth of U.K. exporters.
U.K. BUSINESS SENTIMENT HAS REBOUNDED
65
60
55
53.3
52.9
50
45
2/14
8/14
2/15
8/15
U.K. Manufacturing PMI
2/16
8/16
U.K. Services PMI
Source: Bloomberg, 8/31/16.
Canada shows signs of earnings improvement. Earnings growth has been tough
to come by in Canada in recent years, but the outlook appears to be brightening.
If current estimates prove correct, Canadian earnings will grow as much as 20% during
2017, representing only the second year of earnings growth since 2011. The profits
downturn during the past two years can be almost entirely attributed to the commodity
price collapse since mid-2014 and the effect this had on energy and materials sector
earnings. By contrast, earnings estimates for resource sectors have turned sharply
higher for this year and next, reflecting expectations for stable to slightly higher prices
for precious metals, industrial metals and crude oil, as well as leaner operations
following sharp cuts to capex and employment. Whether this pace of earnings growth
is achievable remains to be seen: The most recent meeting of the Bank of Canada
raised cautionary overtones about the outlook for the Canadian economy.
SEP TEMBER [5]
Emerging Markets
Turning Insight Into Action
The stars may be aligned for a rally in
emerging markets, at least in the short
term, but investors should be aware of
the risks and remain very selective.
Consider accessing specific countries
or regions, or use an active manager
with expertise to identify potential
opportunities.
C ONSIDER
iShares Core MSCI Emerging Markets
ETF (IEMG), iShares MSCI India ETF
(INDA), iShares Edge MSCI Min Vol
Emerging Markets ETF (EEMV), Total
Emerging Markets Fund (BEEIX)
We are overweight emerging market equities. Given recent macroeconomic data, we
see potential upside to consensus estimates of global growth, which, combined with the
continued slow path of interest rate normalization in the United States, supports EM
currency stability, as well as commodity prices and recovery in emerging market export
growth. From a fundamental perspective, we are seeing positive macro adjustments
across many EM economies, which is starting to feed into upgrades of corporate
earnings. Meanwhile, valuations remain attractive in comparison to developed markets
and the asset class is broadly underowned in global portfolios. We see a sudden
appreciation in the U.S. dollar as the main risk to our outlook to emerging markets,
although this is not our base case scenario. We continue to favor countries with reform
catalysts and solid economic improvements, including India and ASEAN countries.
EM EARNINGS REVISIONS AND EXPORTS
75
ANNUAL CHANGE (%)
50
25
0
-25
-50
9/06
9/07
9/08
Exports
9/09
9/10
9/11
9/12
9/13
9/14
9/15
9/16
MSCI Emerging Market 12-Month Forward Earnings
Sources: Thomson Reuters, MSCI Emerging Market Index, as of 9/3/2016.
We've become more constructive and are slightly overweight China. As expected,
macroeconomic indicators have been showing signs of a moderate deceleration as
the impact of stimulus earlier in the year fades. We continue to see China’s economic
transition as ongoing, yet we expect a nonlinear growth path as policymakers juggle
between fiscal and monetary stimulus, and structural reform. After months of slow
and steady devaluation, the renminbi has found some stability; the currency will be
added next month to the IMF Special Drawing Rights basket, which should provide
further support. Going forward, many of the risks, including lower GDP growth rates,
seem to be priced into Chinese stock markets. We believe China offers selective
opportunities for long-term investors and have a preference for offshore equities,
mostly based on valuations.
[6]
BLACKROCK INVESTMENT DIRECTIONS
We are overweight India. The country continues to demonstrate the best structural
growth profile among emerging markets, in our view. Measures of domestic consumption
continue to pick up and should help support growth for the remainder of the year.
Despite an uptick in inflation over the summer, the data overall continue to point toward
moderation in prices and reinforce the central bank’s easing bias. Sustained government
capital expenditure is also likely to help support a recovery in corporate earnings.
Meanwhile, structural reform momentum continues, including recent further
liberalization of foreign direct investments and noteworthy progress in the process
of reforming the country’s tax system. Private investment remains the missing link.
3,000
5,000
2,500
3,500
MILLIONS OF USD
BILLIONS OF INR
INDIAN GOVERNMENT EXPENDITURE AND FDI
2,000
2,000
2/12
5/12
8/12
11/12
2/13
5/13
8/13
11/13
2/14
5/14
8/14
11/14
Government Consumption - 1yr Moving Avg. (LHS)
2/15
5/15
8/15
11/15
2/16
5/16
Gross FDI - 1yr Moving Avg. (RHS)
Source: Thomson Reuters Datastream, as of 5/13/16.
We have a long-term favorable outlook for the ASEAN region. Growth in the region
has been picking up, partly reflecting the impact of fiscal stimulus in Indonesia.
The region is benefiting from many of the same tailwinds as other emerging markets,
while significant economic adjustments are now behind us. The latter have allowed for
interest rate cuts in many countries, and the global outlook provides space for further
monetary policy accommodation. Prospects of political change are driving expectations
of structural reform and fiscal stimulus across the region—particularly in areas such as
infrastructure—which would bolster growth. Valuations remain on the cheaper side,
particularly in comparison to developed markets and other emerging regions.
We maintain our neutral stance on Brazil. The presidential impeachment saga seems to
have reached an end. With a new president sworn in, market focus is likely to shift toward
the new administration and its ability to deliver on reform promises. Although a new
government committed to policy changes may go a long way toward restoring investor
confidence, the approval process for many necessary structural reforms will be
complicated and may result in a higher degree of political uncertainty going forward.
Strong performance this year indicates that good news has been embedded into
markets and therefore, there is room for disappointment. From an economic perspective,
the Brazilian economy is showing the first signs of a turnaround from one of the country’s
deepest recessions in history, but we do not anticipate a fast economic recovery.
SEP T EMBER [7]
Fixed Income
With interest rates still at historic lows
in the United States, fixed income
investors continue to face challenges
in their bond portfolios.
Manage Interest Rate Duration
Consider a flexible strategy with the
ability to actively manage duration.
CONSIDER
Strategic Income Opportunities Fund
(BSIIX), Strategic Municipal
Opportunities Fund (MAMTX), Global
Long/Short Credit Fund (BGCIX)
Manage Interest Rate Risk
Seek to reduce interest rate risk
through time by using a diversified
bond ladder and matching term
maturity to specific investing needs.
CONSIDER
iBonds® ETFs
Seek Income
Cast a wider net for income while
seeking to carefully balance the
tradeoffs between yield and risk.
With the dollar more stable, seek
opportunities outside the U.S.
CONSIDER
Multi-Asset Income Fund (BIICX), High
Yield Bond Fund (BHYIX), Strategic
Global Bond Fund (MAWIX), iShares
iBoxx $ High Yield Corporate Bond ETF
(HYG), iShares iBoxx $ Investment Grade
Corporate Bond ETF (LQD), iShares
International Treasury Bond ETF (IGOV),
iShares National Muni Bond ETF (MUB),
National Municipal Fund (MANLX)
Build a Diversified Core Action
Consider using core bonds for potential
diversification benefits and possible
protection from unforeseen shocks to
equity markets.
CONSIDER
Total Return Fund (MAHQX), iShares
Core U.S. Aggregate Bond ETF (AGG),
iShares Edge U.S. Fixed Income
Balanced Risk ETF (FIBR), iShares Core
International Aggregate Bond ETF
(IAGG), iShares TIPS Bond ETF (TIP)
We remain neutral U.S. Treasuries. Interest rates have broken out of their range and
moved higher on a significant increase in volatility surrounding uncertain global
central bank policy evolution. The back end of global curves appears more
vulnerable, leaving less support for longer duration bonds. For the longer-term, TIPS
also provide some attractive opportunities as valuations are compelling compared
to the future inflation outlook.
We maintain a benchmark view in high yield. Yield levels have compressed compared
to earlier in the year and rising risk-free rates make the prospect of further price
appreciation challenging. Income remains an attractive source of return, but
heightened downside risks versus valuations keep us neutral.
We remain overweight investment grade corporates. While spreads have recently
stabilized after several months of tightening, fundamentals remain intact as global
demand for high quality income persists.
We have downgraded municipal bonds to neutral. Municipal bond valuations have
tightened significantly over the past few months, and in the near term supply and
demand technicals could worsen. Higher risk-free rates and steeper curves also
challenge the near-term outlook. Longer term, municipal bonds' consistent,
tax-preferred income makes them a core holding for income-seeking investors, but
rate risks and valuations drop this sector to neutral.
We are neutral on non-U.S. developed market debt. The absolute level of yields
makes most of this sovereign debt challenging on a risk/return basis. There is also
vulnerability to currency volatility, as evidenced by the reaction to hawkish Fed
posturing and dollar strengthening in late August.
We remain overweight EM debt. While spreads have tightened significantly over the
course of the year and further tightening may be limited, we believe that the global
backdrop of low/negative rates will result in ongoing demand for higher yielding
assets such as EM debt. That said, we favor hard currency EM debt over local
currency due to USD currency volatility that is likely to persist as the Fed wrestles
with the timing of the next rate hike.
J.P. MORGAN EMBI GLOBAL SPREAD
600
550
SPREAD (bps)
Turning Insight Into Action
500
450
400
350
300
12/15
[8]
1/16
2/16
Source: Bloomberg, as of 9/8/16.
BLACKROCK INVESTMENT DIRECTIONS
3/16
4/16
5/16
6/16
7/16
8/16
9/16
Hot Topic: A Bridge to Somewhere?
In an election marked by wide differences on most policies, there is one area of
rare agreement between Hillary Clinton and Donald Trump: The need to increase
spending on infrastructure projects. (They disagree on how to fund such spending.)
Indeed, a growing consensus of the need for increased infrastructure project
spending is a global trend. In Japan, the government announced in July a 28 trillion
yen ($273 billion) stimulus package, of which 13.5 trillion yen ($132 billion) is
earmarked as fiscal spending, with the main focus on public infrastructure projects.
Similarly, the United Kingdom appears ready to incorporate aggressive stimulus.
An important catalyst for the interest in increased infrastructure spending is a
sense that monetary policy as a way to boost growth seems to have reached its
effectiveness. It is no coincidence that countries like Japan, which has been
engaged in a multi-year quantitative easing program, or the United Kingdom, facing
its first recession since the financial crisis, are the ones moving forward with the
effort. And in the United States, San Francisco Fed President John Williams recently
published a paper discussing the importance of fiscal policy for longer-run goals.
Turning Insight Into Action
To gain exposure to global
infrastructure companies, investors
may want to consider the iShares
Global Infrastructure ETF (IGF). For
U.S. exposures, clients may consider
the iShares Transportation Average
ETF (IYT) or the iShares U.S.
Industrials ETF (IYJ).
Meanwhile, central bank policies, which have pushed interest rates to all-time lows
(even negative in many cases), have driven down the cost to borrow. This has
conveniently created an environment that could be advantageous for funding
stimulus programs. Using government debt to finance infrastructure projects is the
cheapest it’s been in decades.
This bodes well for companies working on infrastructure projects—but comes with
some significant caveats. It is important to note that there will most likely be a
significant delay between proposals of greater infrastructure spending and passage
of bills to actually disburse money, as the example of President Obama’s stimulus
program in 2009 shows. And even if there is some consensus on the issue, one
should not underestimate the ongoing political gridlock in the United States.
Still, should the stars align for greater infrastructure spending, equity sectors and
industries related to infrastructure activities, like industrials or transportation in
the United States specifically, may stand to benefit.
8
13
12
11
10
9
8
7
6
5
4
3
ANNUALIZED GDP (%)
6
4
2
0
-2
-4
-6
-8
-10
5/07 11/07 5/08 11/08 5/09 11/09 5/10 11/10 5/11 11/11 5/12 11/12 5/13 11/13 5/14 11/14 5/15 11/15 5/16
U.S. GDP
Eurozone GDP
Japan GDP
U.K .GDP
Cumulative Central Bank Balance Sheet Assets
CUMULATIVE BALANCE SHEET ASSETS ($tn)
IMPACT OF EXPANSIVE CENTRAL BANK STIMULUS ON GDP
Sources: Thomson Reuters Datastream, National Statistics Offices, global central banks, BlackRock Investment Institute, as of 8/22/16.
Note: The GDP lines show the year-over-year GDP growth for specific economies. The cumulative central bank balance sheet assets line sums USD balance sheet assets for the Federal
Reserve, European Central Bank, Bank of Japan and Bank of England.
SEP T EMBER [9]
DRILLING DOWN: EQUITY AND FIXED INCOME OUTLOOKS
OUR VIEW AND OUTLOOK
Global Region
neutral
underweight
United States
Canada
Eurozone
United Kingdom
DEVELOPED MARKETS
overweight
North America
Asia Pacific
Japan
Asia Pacific
China
India
South Korea
Brazil
Mexico
underweight
neutral
overweight
U.S. TIPS
U.S. Investment Grade Credit
U.S. High Yield Credit
U.S. Municipals
U.S. Mortgage-Backed Securities
Non-U.S. Developed Markets
Emerging Markets
U.S. Treasuries
underweight
Gold
– unattractive
neutral
+ attractive
underweight outlook
slightly underweight outlook
slightly overweight outlook
overweight outlook
neutral
David Kurapka, Editor, is Head of Investment Communications
for the ISI group.
Stephen Laipply is Product Strategist for BlackRock’s ModelBased Fixed Income Portfolio Management Group.
Kurt Reiman is BlackRock’s Chief Investment Strategist for
Canada and is a member of the BlackRock Investment
Institute (BII).
Heidi Richardson is the Head of Investment Strategy for U.S.
iShares, part of the ISI group.
Latin America
Fixed Income Sector
Heather Apperson is an Investment Strategist for the iShares
Investment Strategies and Insight (ISI) group.
Maria Eugenia Heyaca is an Investment Strategist for the
ISI group.
Europe
EMERGING MARKETS
Contributors
Matt Tucker, CFA, is the Head of North American Fixed Income
iShares Strategy within BlackRock’s Fixed Income Portfolio
Management team.
Tushar Yadava is an Investment Strategist for the ISI group.
Madeline Zeiss is an Analyst for the ISI group.
overweight
current neutral outlook
LET US KNOW…
How do you use this market commentary and do
you find it useful? Please share your feedback
and any questions or concerns you have at
blackrockinvestments@blackrock.com.
You also can find the latest market
commentary from the Investment Strategy
Group at BlackRockblog.com, BlackRock.com
and iShares.com.
Underweight: Potentially decrease allocation
Neutral: Consider benchmark allocation
Overweight: Potentially increase allocation
This information is strictly for illustrative and educational purposes and is subject to change. This information does not represent the actual current, past or future holdings or portfolio of any
BlackRock client.
[10]
BLACKROCK INVESTMENT DIRECTIONS
WHY BLACKROCK®
BlackRock helps people around the world, as well as the world’s largest institutions and governments, pursue their
investing goals. We offer:
}A comprehensive set of innovative solutions, including mutual funds, separately managed accounts,
alternatives and iShares® ETFs
} Global market and investment insights
} Sophisticated risk and portfolio analytics
We work only for our clients, who have entrusted us with managing $4.89 trillion, earning BlackRock the distinction
of being trusted to manage more money than any other investment firm in the world.*
Want to know more?
blackrock.com
* Source: BlackRock. Based on $4.89 trillion in AUM as of 6/30/16.
SEP T EMBER [11]
This material represents an assessment of the market environment as of the date indicated; is
subject to change; and is not intended to be a forecast of future events or a guarantee of future
results. This information should not be relied upon by the reader as research or investment advice
regarding the funds or any issuer or security in particular. The strategies discussed are strictly for
illustrative and educational purposes and should not be construed as a recommendation to
purchase or sell, or an offer to sell or a solicitation of an offer to buy any security. There is no
guarantee that any strategies discussed will be effective.
The information presented does not take into consideration commissions, tax implications, or other
transactions costs, which may significantly affect the economic consequences of a given strategy
or investment decision. This document contains general information only and does not take into
account an individual's financial circumstances. An assessment should be made as to whether the
information is appropriate in individual circumstances and consideration should be given to talking
to a financial advisor before making an investment decision.
Carefully consider the Funds’ investment objectives, risk factors, and charges
and expenses before investing. This and other information can be found in the
Funds’ prospectuses or, if available, the summary prospectuses which may be
obtained by visiting iShares.com or BlackRock.com. Read the prospectus
carefully before investing.
Investing involves risk, including possible loss of principal.
The BlackRock funds are actively managed and their characteristics will vary. Investing in long/
short strategies presents the opportunity for significant losses, including the loss of your total
investment. Such strategies have the potential for heightened volatility and, in general, are not
suitable for all investors.
International investing involves risks, including risks related to foreign currency, limited liquidity, less
government regulation and the possibility of substantial volatility due to adverse political, economic
or other developments. These risks often are heightened for investments in emerging/developing
markets, in concentrations of single countries or smaller capital markets. Frontier markets involve
heightened risks related to the same factors and may be subject to a greater risk of loss than
investments in more developed and emerging markets. There is no guarantee that any fund will
pay dividends.
Fixed income risks include interest-rate and credit risk. Typically, when interest rates rise, there is
a corresponding decline in bond values. Credit risk refers to the possibility that the bond issuer will
not be able to make principal and interest payments. There may be less information on the financial
condition of municipal issuers than for public corporations. The market for municipal bonds may
be less liquid than for taxable bonds. Some investors may be subject to federal or state income
taxes or the Alternative Minimum Tax (AMT). Capital gains distributions, if any, are taxable.
Noninvestment-grade debt securities (high-yield/junk bonds) may be subject to greater market
fluctuations, risk of default or loss of income and principal than higher-rated securities.
The iShares Currency Hedged Fund's use of derivatives may reduce the Fund's returns and/or
increase volatility and subject the Fund to counterparty risk, which is the risk that the other party
in the transaction will not fulfill its contractual obligation. The Fund could suffer losses related to its
derivative positions because of a possible lack of liquidity in the secondary market and as a result
of unanticipated market movements, which losses are potentially unlimited. There can be no
assurance that the Fund's hedging transactions will be effective. Investment in the Fund is subject
to the risk of the underlying Funds.
An investment in the Fund(s) is not insured or guaranteed by the Federal Deposit Insurance
Corporation or any other government agency and its return and yield will fluctuate with market
conditions.
There can be no assurance that performance will be enhanced for funds that seek to provide
exposure to certain quantitative investment characteristics ("factors"). Exposure to such investment
factors may detract from performance in some market environments, perhaps for extended
periods. In such circumstances, a fund may seek to maintain exposure to the targeted investment
factors and not adjust to target different factors, which could result in losses.
Funds that concentrate investments in specific industries, sectors, markets or asset classes may
underperform or be more volatile than other industries, sectors, markets or asset classes and than
the general securities market. Technology companies may be subject to severe competition and
product obsolescence. The iShares Minimum Volatility ETFs may experience more than minimum
volatility as there is no guarantee that the underlying index's strategy of seeking to lower volatility
will be successful.
The iShares Funds are not sponsored, endorsed, issued, sold or promoted by Markit Indices
Limited, MSCI Inc., or S&P Dow Jones Indices LLC. None of these companies make any
representation regarding the advisability of investing in the Funds. BlackRock is not affiliated with
the companies listed above. Index data related to the underlying indexes is provided by the
respective companies above.
The iShares Funds and BlackRock mutual funds that are registered with the U.S. Securities and
Exchange Commission under the Investment Company Act of 1940 (“Funds”) are distributed in
the U.S. by BlackRock Investments, LLC (together with its affiliates, “BlackRock”).
This material is solely for educational purposes and does not constitute an offer or solicitation to
sell or a solicitation of an offer to buy any shares of any fund (nor shall any such shares be offered
or sold to any person) in any jurisdiction in which an offer, solicitation, purchase or sale would be
unlawful under the securities law of that jurisdiction.
In Latin America: FOR INSTITUTIONAL AND PROFESSIONAL INVESTORS ONLY
(NOT FOR PUBLIC DISTRIBUTION)
It is possible that some or all of the funds mentioned or inferred to in this material have not been
registered with the securities regulator of Brazil, Chile, Colombia, Mexico, Peru, Uruguay or any
other securities regulator in any Latin American country, and thus, might not be publicly offered
within any such country. The securities regulators of such countries have not confirmed the
accuracy of any information contained herein. No information discussed herein can be provided
Not FDIC Insured • May Lose Value • No Bank Guarantee
Lit. No. MKT-ID-0916
USR-10273-0916 / 169744T-0916
to the general public in Latin America.
In Hong Kong, this information is issued by BlackRock Asset Management North Asia Limited.
This material is for distribution to “Professional Investors” (as defined in the Securities and Futures
Ordinance (Cap.571 of the laws of Hong Kong)) and should not be relied upon by any other
persons. In Singapore, this document is issued by BlackRock (Singapore) Limited (company
registration number: 200010143N) for institutional investors only. For distribution in Korea and
Taiwan for Institutional Investors only (or “professional clients,” as such term may apply in local
jurisdictions). This document is for distribution to professional and institutional investors only and
should not be relied upon by any other persons. This document is provided for informational
purposes only and does not constitute a solicitation of any securities or BlackRock funds in any
jurisdiction in which such solicitation is unlawful or to any person to whom it is unlawful. Moreover,
it neither constitutes an offer to enter into an investment agreement with the recipient of this
document nor an invitation to respond to it by making an offer to enter into an investment
agreement. Past performance is not a guide to future performance. There are risks associated
with investing, including loss of principal. Changes in the rates of exchange between currencies
may cause the value of investments to fluctuate. This document is for informational purposes only
and does not constitute an offer or invitation to anyone to invest in any BlackRock fund and has
not been prepared in connection with any such offer. Any research in this document has been
procured and may have been acted on by BlackRock for its own purpose. The results of such
research are being made available only incidentally. The views expressed do not constitute
investment or any other advice and are subject to change. They do not necessarily reflect the
views of any company in the BlackRock Group or any part thereof and no assurances are made
as to their accuracy. This document contains general information only and does not take into
account an individual’s circumstances and consideration should be given to talking to a financial
or other professional adviser before making an investment decision. You are reminded to refer to
the relevant prospectus for specific risk considerations which are available from BlackRock
websites. BlackRock® is a registered trademark of BlackRock, Inc., or its subsidiaries in the
United States and elsewhere. All other trademarks, servicemarks or registered trademarks are the
property of their respective owners. © 2016 BlackRock Inc. All rights reserved.
Notice to residents in Australia:
FOR WHOLESALE CLIENTS AND PROFESSIONAL INVESTORS ONLY –
NOT FOR PUBLIC DISTRIBUTION
Issued in Australia by BlackRock Investment Management (Australia) Limited ABN 13 006 165
975, AFSL 230523 (“BlackRock”). This information is provided for ‘wholesale clients’ and
‘professional investors’ only. Before investing in an iShares exchange traded fund, you should
carefully consider whether such products are appropriate for you, read the applicable prospectus
or product disclosure statement available at iShares.com.au and consult an investment adviser.
Past performance is not a reliable indicator of future performance. Investing involves risk including
loss of principal. No guarantee as to the capital value of investments nor future returns is made by
BlackRock or any company in the BlackRock group. Recipients of this document must not
distribute copies of the document to third parties. This information is indicative, subject to change,
and has been prepared for informational or educational purposes only. No warranty of accuracy
or reliability is given and no responsibility arising in any way for errors or omissions (including
responsibility to any person by reason of negligence) is accepted by BlackRock. No representation
or guarantee whatsoever, express or implied, is made to any person regarding this information.
This information is general in nature and has been prepared without taking into account any
individual's objectives, financial situation, or needs. You should seek independent professional
legal, financial, taxation, and/or other professional advice before making an investment decision
regarding the iShares funds. An iShares fund is not sponsored, endorsed, issued, sold or
promoted by the provider of the index which a particular iShares fund seeks to track. No index
provider makes any representation regarding the advisability of investing in the iShares funds.
Notice to investors in New Zealand:
FOR WHOLESALE CLIENTS ONLY – NOT FOR PUBLIC DISTRIBUTION
This material is being distributed in New Zealand by BlackRock Investment Management
(Australia) Limited ABN 13 006 165 975, AFSL 230523 ("BlackRock"). In New Zealand, this
information is provided for registered financial service providers and other wholesale clients only
in that capacity, and is not provided for New Zealand retail clients as defined under the Financial
Advisers Act 2008. BlackRock does not offer interests in iShares to the public in New Zealand,
and this material does not constitute or relate to such an offer. Before investing in an iShares
exchange traded fund, you should carefully consider whether such products are appropriate for
you, read the applicable prospectus or product disclosure statement available at iShares.com.au
and consult an investment adviser. Past performance is not a reliable indicator of future
performance. Investing involves risk including loss of principal. No guarantee as to the capital value
of investments nor future returns is made by BlackRock or any company in the BlackRock group.
Recipients of this document must not distribute copies of the document to third parties. This
information is indicative, subject to change, and has been prepared for informational or
educational purposes only. No warranty of accuracy or reliability is given and no responsibility
arising in any way for errors or omissions (including responsibility to any person by reason of
negligence) is accepted by BlackRock. No representation or guarantee whatsoever, express or
implied, is made to any person regarding this information. This information is general in nature and
has been prepared without taking into account any individual's objectives, financial situation, or
needs. You should seek independent professional legal, financial, taxation, and/or other
professional advice before making an investment decision regarding the iShares funds. An iShares
fund is not sponsored, endorsed, issued, sold or promoted by the provider of the index which a
particular iShares fund seeks to track. No index provider makes any representation regarding the
advisability of investing in the iShares funds.
©2016 BlackRock, Inc. All rights reserved. BLACKROCK, iSHARES, iBONDS and SO
WHAT DO I DO WITH MY MONEY are registered trademarks of BlackRock, Inc. in the United
States and elsewhere. All other marks are the property of their respective owners.

