Chebyshev`s Theorem and the Empirical Rule
advertisement

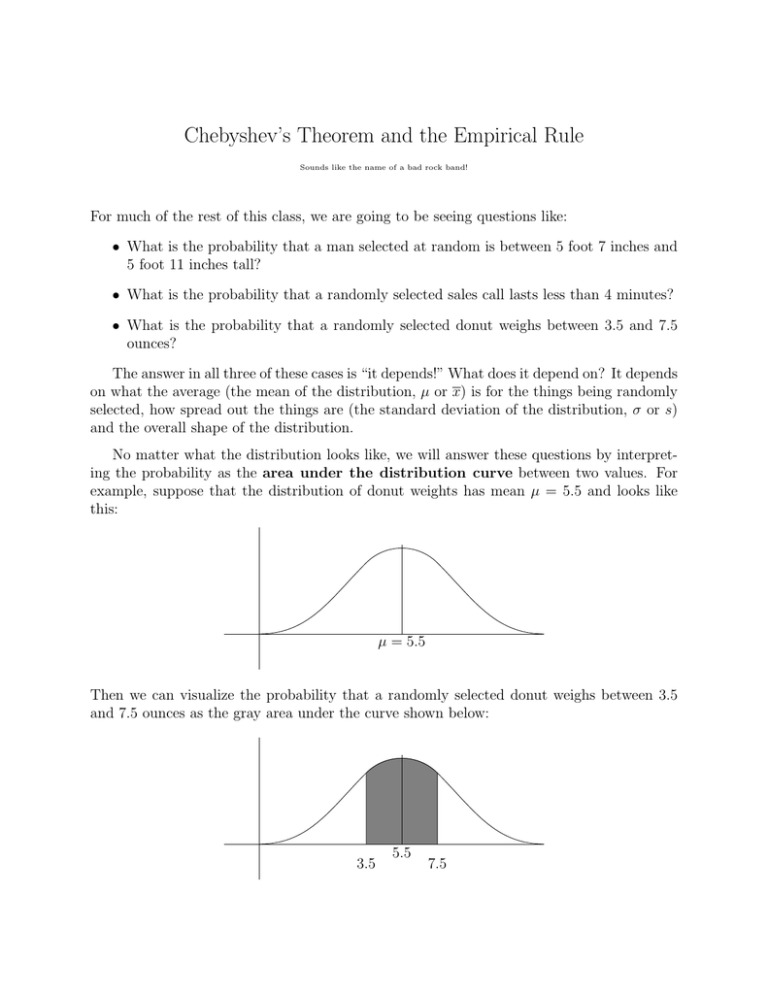
Chebyshev’s Theorem and the Empirical Rule Sounds like the name of a bad rock band! For much of the rest of this class, we are going to be seeing questions like: • What is the probability that a man selected at random is between 5 foot 7 inches and 5 foot 11 inches tall? • What is the probability that a randomly selected sales call lasts less than 4 minutes? • What is the probability that a randomly selected donut weighs between 3.5 and 7.5 ounces? The answer in all three of these cases is “it depends!” What does it depend on? It depends on what the average (the mean of the distribution, µ or x) is for the things being randomly selected, how spread out the things are (the standard deviation of the distribution, σ or s) and the overall shape of the distribution. No matter what the distribution looks like, we will answer these questions by interpreting the probability as the area under the distribution curve between two values. For example, suppose that the distribution of donut weights has mean µ = 5.5 and looks like this: µ = 5.5 Then we can visualize the probability that a randomly selected donut weighs between 3.5 and 7.5 ounces as the gray area under the curve shown below: 3.5 5.5 7.5 In order to answer these types of questions, we are usually going to want to measure values in terms of how many standard deviations away from the mean the value is. (Soon we’ll be calling this the z-score of the value.) In the donut example, suppose that we are told that the standard deviation of the distribution is σ = 1 ounce (and the mean is still µ = 5.5). Then the value 3.5 is two standard deviations below the mean (for a z-score of z = −2), and 7.5 is two standard deviations above the mean (so z = 2 for this value). We can write this as the interval from µ − 2σ to µ + 2σ, or even shorter as the interval µ ± 2σ. The formula for computing the z-score for a data value x is: z= x−µ σ Example: Consider randomly selected phone calls from a distribution with mean µ = 3.2 minutes and standard deviation σ = 0.6 minutes. Describe the interval between 2 minutes and 5 minutes in terms of standard deviations from the mean (or in terms of z-scores). Answer: The z-score for x = 2 is z= 2 − 3.2 = −2 0.6 and the z-score for x = 5 is 5 − 3.2 =3 0.6 so the interval between 2 and 5 minutes is from two standard deviations below the mean to three standard deviations above the mean. Another way to write this is to say the interval is from µ − 2σ to µ + 3σ. z= Later in the course we’ll get to the exact answers to these kinds of questions. For now Chebyshev’s Theorem and the Empirical Rule allow us to estimate the answers for intervals that are symmetrical about the mean. (That means the same distance on both sides of the mean, like the donut example, but not like the phone call example.) Chebyshev’s Theorem tells us that no matter what the distribution looks like, the probability that a randomly selected values is in the interval µ ± kσ is at least 1 100 1 − 2 % k Example: Suppose a distribution has mean µ = 17.4 and standard deviation σ = 3.2. What does Chebyshev’s Theorem tell us about the probability a randomly selected value is between 12.6 and 22.2? Answer: The values x = 12.6 and x = 22.2 correspond to z = −1.5 and z = 1.5. So the interval can be written as µ − 1.5σ to µ + 1.5σ, or as µ ± 1.5σ. Chebyshev’s Theorem now tells us that the probability is at least 1 100 1 − % = 55.56% 1.52 Example: Suppose a distribution has mean µ = 111 and standard deviation σ = 7.6. If Chebyshev’s Theorem tells us that 81.1% of the values are between a and b (symmetrical about the mean), then what are these limits? Answer: First we note that 1 % = 81.1% 100 1 − 2 k and if we solve this for k we get k = 2.3. That means the limits are 2.3 standard deviations below the mean to 2.3 standard deviations above the mean. a = 111 − 2.3 · 7.6 = 93.52 b = 111 + 2.3 · 7.6 = 128.48 Finally, the Empirical Rule applies only when the distribution is bell shaped. Because we have more information about the shape of the distribution, we can be more certain of our predictions and the percentages are higher than Chebyshev’s Theorem gives us. The Empirical Rule tells us that for a bell-shaped distribution approximately 68% of the values will be within 1 standard deviation, 95% will be within 2 standard deviations and 99.7% will be within 3 standard deviations of the mean.


