Focus 1 Japan`s recent net export performance
advertisement

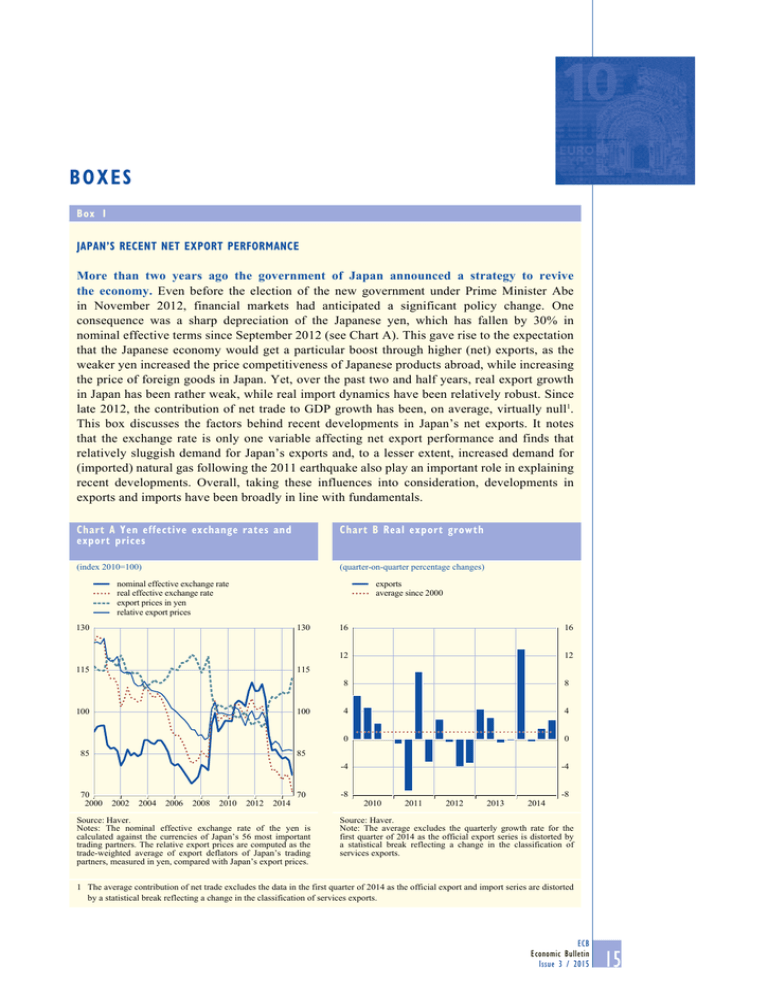
BOXES Box 1 Japan’s recent net export performance More than two years ago the government of Japan announced a strategy to revive the economy. Even before the election of the new government under Prime Minister Abe in November 2012, financial markets had anticipated a significant policy change. One consequence was a sharp depreciation of the Japanese yen, which has fallen by 30% in nominal effective terms since September 2012 (see Chart A). This gave rise to the expectation that the Japanese economy would get a particular boost through higher (net) exports, as the weaker yen increased the price competitiveness of Japanese products abroad, while increasing the price of foreign goods in Japan. Yet, over the past two and half years, real export growth in Japan has been rather weak, while real import dynamics have been relatively robust. Since late 2012, the contribution of net trade to GDP growth has been, on average, virtually null1. This box discusses the factors behind recent developments in Japan’s net exports. It notes that the exchange rate is only one variable affecting net export performance and finds that relatively sluggish demand for Japan’s exports and, to a lesser extent, increased demand for (imported) natural gas following the 2011 earthquake also play an important role in explaining recent developments. Overall, taking these influences into consideration, developments in exports and imports have been broadly in line with fundamentals. chart a Yen effective exchange rates and export prices chart B real export growth (index 2010=100) (quarter-on-quarter percentage changes) nominal effective exchange rate real effective exchange rate export prices in yen relative export prices exports average since 2000 130 130 115 115 100 100 85 85 70 2000 2002 2004 2006 2008 2010 2012 2014 70 Source: Haver. Notes: The nominal effective exchange rate of the yen is calculated against the currencies of Japan’s 56 most important trading partners. The relative export prices are computed as the trade-weighted average of export deflators of Japan’s trading partners, measured in yen, compared with Japan’s export prices. 16 16 12 12 8 8 4 4 0 0 -4 -4 -8 2010 2011 2012 2013 2014 -8 Source: Haver. Note: The average excludes the quarterly growth rate for the first quarter of 2014 as the official export series is distorted by a statistical break reflecting a change in the classification of services exports. 1 The average contribution of net trade excludes the data in the first quarter of 2014 as the official export and import series are distorted by a statistical break reflecting a change in the classification of services exports. ECB Economic Bulletin Issue 3 / 2015 15 Since late 2012 average export growth in Japan has been rather modest. While export growth picked up sharply at the start of the yen’s depreciation, the expansion stalled in the following four quarters, recovering only in the second half of last year (see Chart B). Looking past the volatility, average quarterly growth since the fourth quarter of 2012 has been 1%.2 While this is in line with average growth since 2000, it is weaker than that experienced during earlier episodes of sharp yen depreciation. The main factor behind this modest export growth has been weaker than expected external demand. Foreign demand has been particularly weak in the last two years, in part reflecting the broad weakness in global trade since 2011. But Japan has suffered, in particular, from slowing growth in its main export markets, especially China and the rest of emerging Asia, where import growth since 2012 has been well below past averages (see Chart C). At the same time, Japan has continued to suffer from a decline in its export market share, which may be partly related to the long-standing trend in Japan to shift production overseas (see Chart D), with firms increasingly serving demand through foreign subsidiaries. Nevertheless, Japanese exports have still reaped some benefits from the yen’s sharp depreciation through the associated improvement in price competitiveness, which has partially offset the weakness in foreign demand. The nominal effective exchange rate of the yen has declined by 30% since the peak in the third quarter of 2012. At the same time, taking into account movements in export prices in other countries, Japan’s relative export price has declined by 13% since 2012, meaning that Japan has witnessed a sizeable improvement in price competitiveness (see Chart A). That, in turn, supported export growth. As Japanese exporters 2 See footnote 1. 16 ECB Economic Bulletin Issue 3 / 2015 chart c change in import growth in Japan’s main export markets (percentage point change in average annual growth 2012-2014 relative to 2000-2014) 0 0 -1 -1 -2 -2 -3 -3 -4 -4 -5 -5 -6 -6 -7 -7 -8 -8 -9 1 2 3 4 5 -9 1 euro area (9) 2 United States (16) 3 China (19) 4 emerging Asia (excluding China) (36) 5 total Source: Haver. Note: Figures in brackets show the share of total exports going to each region in 2012. chart D overseas subsidiaries’ sales and exports (nominal sales and exports, index 1999 Q1=100) exports overseas subsidiaries’ sales 350 350 300 300 250 250 200 200 150 150 100 100 50 1999 2002 2005 2008 2011 Source: Ministry of Economy, Trade and Industry. 2014 50 Boxes Japan’s recent net export performance adjusted their prices in foreign currency downwards only partially, this implied a substantial increase in export prices in yen, thereby boosting exporters’ profits. That also helped Japanese exporters to reverse some of the margin compression suffered when the yen had appreciated substantially after the financial crisis. The recent pass-through of exchange rate changes to export prices is broadly consistent with past experience. Estimates in the literature suggest that the pass-through from the exchange rate depreciation to Japan’s export price in importers’ currencies is typically less than one, suggesting that some exporters are “pricing to market”. This may be related to Japan’s invoicing practice; compared with other advanced economies, Japan invoices only a small proportion of its exports in its own currency. Robust import growth has also weighed on the contribution of net exports to GDP growth. Since early 2013 imports have expanded, on average, by 1.5% quarter-on-quarter – stronger than the average pace of growth since 2000. The recent period of yen depreciation has been marked by considerable volatility, mostly reflecting the front-loading of demand prior to the VAT hike of April 2014, when imports increased sharply. Having fallen in the following quarters, import growth resumed towards the end of last year, more in line with historical averages (see Chart E). The path of import growth has been shaped mostly by changes in final demand, with price changes playing a comparatively modest role. In Japan, import dynamics have typically been relatively price-insensitive, with low long-term price elasticity. This, in turn, implies that although the depreciation of the yen led to an increase in the relative prices of imported goods vis-à-vis domestically produced goods, it created only a marginal headwind for import growth in recent quarters. This may reflect the high share of commodity imports, for which demand is typically less sensitive to price changes. Moreover, Japan’s demand for energy imports has been chart e real import growth chart f Import volumes of liquid natural gas (quarter-on-quarter growth, percentage changes and percentage point contributions) (thousand tonnes, 12-month averages) imports of services imports of goods imports of goods and services average since 2000 8 8 8,000 8,000 6 6 7,000 7,000 4 4 6,000 6,000 2 2 5,000 5,000 0 0 -2 -2 4,000 4,000 -4 -4 3,000 3,000 -6 2,000 -6 2010 Source: Haver. 2011 2012 2013 2014 1996 1998 2000 2002 2004 2006 2008 2010 2012 2014 2,000 Source: Haver. ECB Economic Bulletin Issue 3 / 2015 17 particularly high since the 2011 Fukushima disaster, which forced Japanese power generators to switch swiftly to (mostly imported) fossil fuels. Since then, the volume of natural gas imports has increased by around 40% (see Chart F). Overall, developments in exports and imports have been broadly in line with fundamentals. Recent export growth has indeed been rather modest given the yen’s depreciation, but the main factor behind this weakness is sluggish external demand, particularly from China and emerging Asia – Japan’s main export markets. Japanese exports have benefited from improved price competitiveness, with the recent pass-through of exchange rate changes to export prices broadly consistent with past experience. By contrast, import growth has been relatively robust since the yen depreciated, mostly driven by strong domestic demand, particularly ahead of the VAT increase. The higher volume of imports also reflects the increased demand for (imported) natural gas following the 2011 Fukushima disaster. 18 ECB Economic Bulletin Issue 3 / 2015


