Influence Propagation in Modular Networks
Aram Galstyan and Paul R. Cohen
USC Information Sciences Institute
Center for Research on Unexpected Events (CRUE)
4676 Admiralty Way, Marina del Rey, CA 90292
{galstyan,cohen}@isi.edu.
The idea behind viral marketing is to use existing social structures for world–of–mouth advertising of products or services (Domingos & Richardson 2001; Leskovec,
Adamic, & Huberman 2006). Instead of targeting customers
indiscriminately, efficient marketing strategies aim at targeting certain customers that will propagate the influence
among many others. An important problem is then to decide
what nodes to target so that the propagation of the influence
will be maximized (Kempe, Kleinberg, & Éva Tardos 2003).
Thus, to understand implications of specific targeting strategies, it is imperative to understand how the influence poropagates through a social network. In recent years there has
been an extensive amount of work on studying various dynamical processes on complex networks. Most of the studies
have focused on the effect of the scale–free degree distribution on dynamical processes. In this paper, we focus on networks that have a modular structure, i.e., they are composed
of clusters, or communities, that are loosely coupled with
each other.
Here we focus on a network composed of only two communities. Specifically, we consider a random graph consisting of N = Na + Nb nodes of two different type, a and b.
The probabilities of edges between nodes of different types
are γaa , γbb and γab = γba , and the average connectivity between nodes of the respective types are then zaa = γaa Na ,
zbb = γbb Nb , zab = γab Nb and zba = γab Na . We want
to find out how the modularity of the network, as described
by the coupling between the groups, affects the cascading
process.
Each node is in one of two states: passive and active.
Initially, all but a small fraction of seed nodes are passive.
During the activation process, a passive node will be activated with probability that depends on the state of its neighborhs. In Watt’s original model (Watts 2004) this probability
is p = Θ(hi /ki − φ), where Θ is the step function, hi and ki
are the number of active neighbors and the total number of
the neighboring nodes, respectively, and φi is the activation
threshold for the i–th node. Here we use a threshold condition on the number of active neighbors rather than their
fraction: p = τ −1 Θ(hi −Hi ), where τ determines the time–
scale of the activation process. We will assume that all nodes
have the same activation threshold, Hi = H for all i.
c 2008, Association for the Advancement of Artificial
Copyright Intelligence (www.aaai.org). All rights reserved.
Below we examine a simplified scenario. Let us assume
that seed nodes are chosen among a–nodes only, and let ρ0a
be the fraction of those seed nodes. Further, let us assume
that the coupling between two populations is not very strong,
so that the cascading process among a–nodes is not affected
by cross-group links. Then the fraction of active a nodes
evolves according to the following equation (Galstyan & Cohen 2007):
dρa
τ
= −ρa + ga (zaa ρa )
(1)
dt
where we have defined
ga (x) = 1 − (1 − ρ0a,b )Q(H, x)
(2)
P
and Q(n, x) = k<n e−x xk /k! is the regularized gamma
function.
Thus, the fraction of the population that will be activated
at the end of the cascading process is determined from the
following steady state equation:
ρsa = ga (zaa ρsa )
(3)
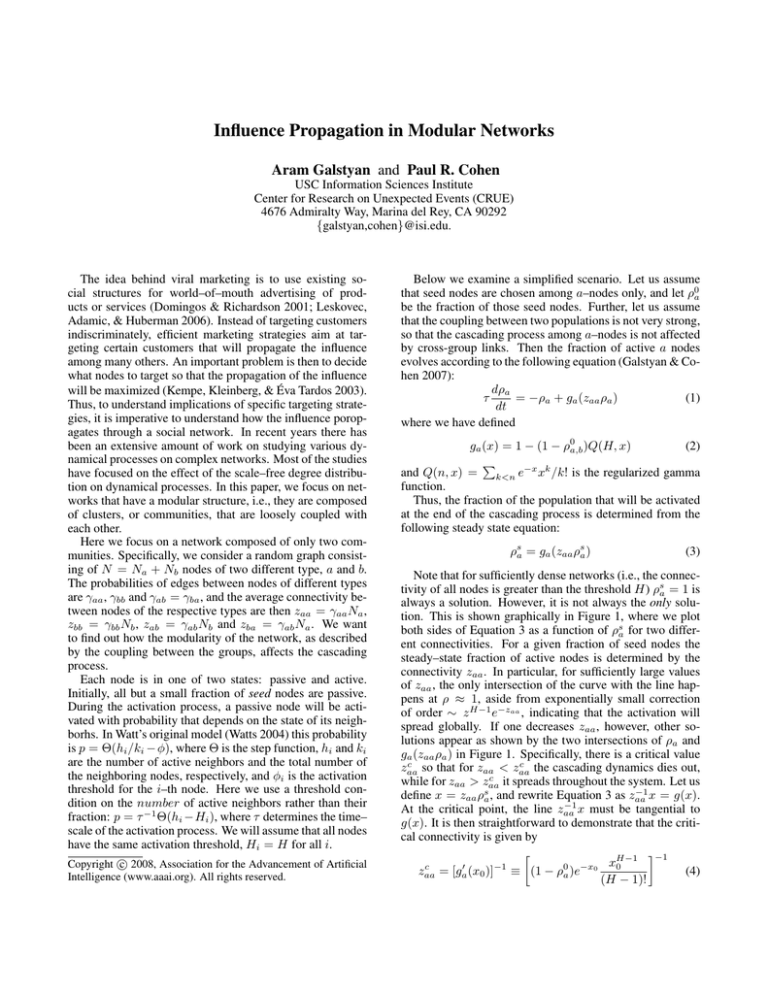
Note that for sufficiently dense networks (i.e., the connectivity of all nodes is greater than the threshold H) ρsa = 1 is
always a solution. However, it is not always the only solution. This is shown graphically in Figure 1, where we plot
both sides of Equation 3 as a function of ρsa for two different connectivities. For a given fraction of seed nodes the
steady–state fraction of active nodes is determined by the
connectivity zaa . In particular, for sufficiently large values
of zaa , the only intersection of the curve with the line happens at ρ ≈ 1, aside from exponentially small correction
of order ∼ z H−1 e−zaa , indicating that the activation will
spread globally. If one decreases zaa , however, other solutions appear as shown by the two intersections of ρa and
ga (zaa ρa ) in Figure 1. Specifically, there is a critical value
c
c
zaa
so that for zaa < zaa
the cascading dynamics dies out,
c
while for zaa > zaa it spreads throughout the system. Let us
−1
define x = zaa ρsa , and rewrite Equation 3 as zaa
x = g(x).
−1
At the critical point, the line zaa x must be tangential to
g(x). It is then straightforward to demonstrate that the critical connectivity is given by
H−1 −1
c
0
−1
0 −x0 x0
zaa = [ga (x0 )] ≡ (1 − ρa )e
(4)
(H − 1)!
1
c
cascade
no cascade
analytical
70
zaa>zaa
zaa<zcaa
60
zcaa
y(ρsa)
50
H=3
40
30
20
10
0
0
ρsa
1
0
0.01
0.02
0.03
0.04
0
Figure 1: Graphical representation of the Equation 3. Plotted are the straight line y = ρsa , and the function y =
ga (zaa ρsa ) for two different values of zaa
where x0 satisfies the following equation:
x0 ga0 (x0 ) = ga (x0 )
(7)
zba ρ0a .
where λ =
Clearly, if λ is sufficiently large, then
the cascade will propagate among b nodes independent of
the within–group connectivity zbb . And vise versa, however
large the connectivity zbb , there is a critical value of λca so
that for λ < λc there will be no cascade among the b nodes.
Let us define x = zbb ρ0b + λ and rewrite the steady state
equation as follows:
x−λ
= gb (x)
(8)
zbb
Using the same reasoning as for the a nodes, it is easy to
show that the critical point is given by
λc = x0 − zbb gb (x0 )
Figure 2: (Color online) The critical connectivity plotted
against the fraction of seed nodes for the threshold parameter
H = 3. The solid line shows the phase boundary obtained
analytically.
(5)
In the limit of small ρ0a one obtains the following scaling
behavior:
H−1
c
zaa
∝ (ρ0a )− H .
(6)
We also note that at the critical point the convergence time
c −1/2
diverges as Tconv ∝ (z − zaa
)
.
In Figure 2 we compare the analytical prediction with
simulation results for H = 2. The simulations were done
for a graph with 5 × 10⁴ nodes, and for 100 random trials.
Each parameter pair (ρ0a , zaa ) was considered to be above
the critical line if a global cascade was observed in the majority of trials for that parameters. Again, the agreement of
analytical prediction and the simulation results are excellent.
Now consider the cascading dynamics in the second
group. Initially, there are no active nodes in this group.
As more and more a nodes are activated, the activation will
spread to the b nodes for sufficiently large across–group connectivity zba . The activation dynamics is again governed
by an equation similar to the Equation. 1. In particular, the
steady state fraction of active b nodes satisfies the following
equation:
ρ0b = 1 − Q(H, zbb ρ0b + λ) ≡ gb (zbb ρ0b + λ).
!a
(9)
where x0 is the smaller of the roots of the following equation:
1
(10)
gb0 (x0 ) =
zbb
Note that for ρ0a = 1 λc is simply the critical across–group
c
connectivity zab
(zbb ) for which the cascade will spread to b
nodes, assuming that all a nodes have already been activated.
Hence, equations 9 and 10 implicitly define a critical line
c
zbb
(zba ) on the zbb − zba plane. Note that on this critical
line the convergence time of the cascading process among
the b-nodes, and consequently the separation of two activity
peaks, is infinite. For a fixed within–group connectivity zbb
the two–tiered structure will be present provided that zba is
only slightly above the critical line. To be more precise,
let ρmax
be the fraction of active a nodes that corresponds
a
to the maximum activation rate among a nodes. This can
be found from Equation 1 by differentiating the right hand
side with respect to ρa and setting it to zero, which yields
zaa ga0 (zaa ρmax
) = 1. If the across—group connectivity is
a
smaller than λc /ρmax
, then the cascade will not spread to b–
a
nodes until the rate of activation spreading among a nodes
starts to decline from its peak. Consequently, the two–tiered
pattern will be present for the range λc < zba < λc /ρmax
.
a
Thus, we have demonstrated that activity spreading in a
network composed of two loosely coupled Erdosh–Renyi
graphs is characterized by a doubly–critical behavior. We
believe that this phenomenon has potential implications for
viral marketing strategies. Indeed, our results suggest that
simple strategies that are suitable for homogenous networks
(e.g., choosing nodes with high connectivity, or at random),
might lead to a sub–optimal solution for networks with
strongly modular structure. To show this, consider a scenario where the size of the group A is much smaller than
group, but with higher link density among the group mem-
bers. In real settings, group A might represent a small but
devoted group of a product followers (e.g., Mac users), while
group B represents the rest of the consumer market. Then,
according to our results, it might be more optimal to target
the members of group A. This is because it is easier to cause
a global cascade in group A, that will later “spill” into the
second, larger group B. We intend to examine this issue
more thoroughly in out future work.
Acknowledgments
This research was supported by the U.S. ARO MURI grant
W911NF–06–1–0094 at the University of Southern California.
References
Domingos, P., and Richardson, M. 2001. Mining the network value of customers. In KDD ’01: Proceedings of the
seventh ACM SIGKDD international conference on Knowledge discovery and data mining, 57–66. New York, NY,
USA: ACM Press.
Galstyan, A., and Cohen, P. 2007. Cascading dynamics in
modular networks. Phys. Rev. E 75:036109.
Kempe, D.; Kleinberg, J.; and Éva Tardos. 2003. Maximizing the spread of influence through a social network.
In KDD ’03: Proceedings of the ninth ACM SIGKDD international conference on Knowledge discovery and data
mining, 137–146. New York, NY, USA: ACM Press.
Leskovec, J.; Adamic, L. A.; and Huberman, B. A. 2006.
The dynamics of viral marketing. In EC ’06: Proceedings
of the 7th ACM conference on Electronic commerce, 228–
237. New York, NY, USA: ACM Press.
Watts, D. 2004. A simple model of global cascades on
random networks. Proc. Natl. Acad. Sci. U.S.A. 99:5766.


