Normal and Abnormal Exercise Response Potential Measurements
advertisement
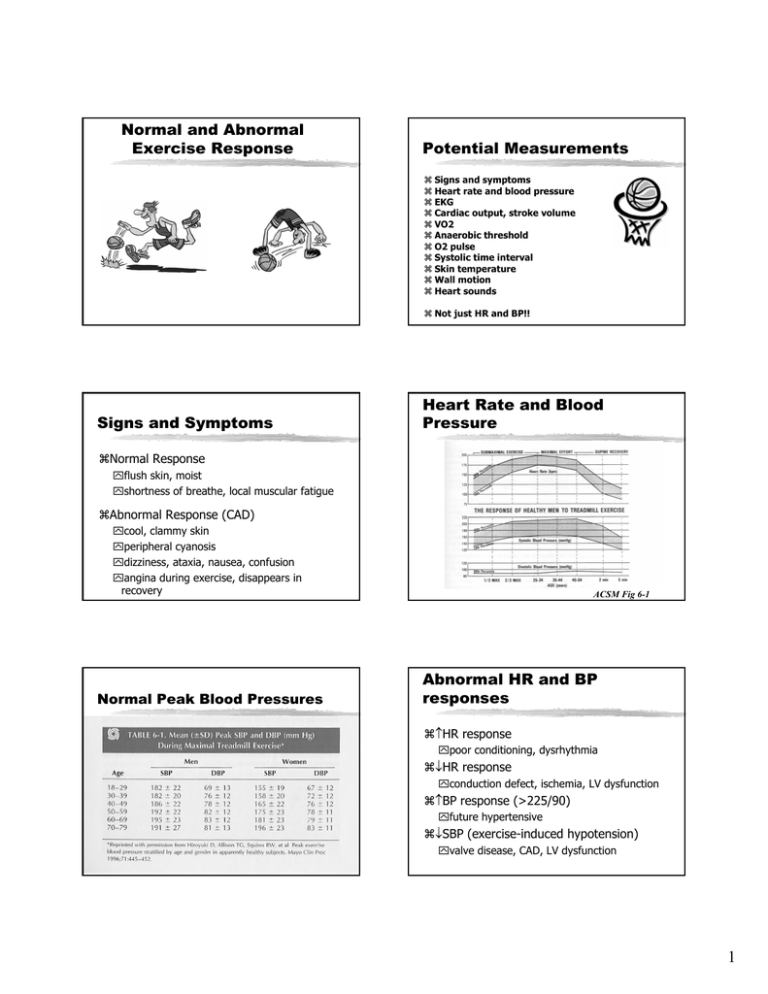
Normal and Abnormal Exercise Response Potential Measurements Signs and symptoms Heart rate and blood pressure EKG Cardiac output, stroke volume VO2 Anaerobic threshold O2 pulse Systolic time interval Skin temperature Wall motion Heart sounds Not just HR and BP!! Signs and Symptoms Heart Rate and Blood Pressure Normal Response flush skin, moist shortness of breathe, local muscular fatigue Abnormal Response (CAD) cool, clammy skin peripheral cyanosis dizziness, ataxia, nausea, confusion angina during exercise, disappears in recovery Normal Peak Blood Pressures ACSM Fig 6-1 Abnormal HR and BP responses ↑HR response poor conditioning, dysrhythmia ↓HR response conduction defect, ischemia, LV dysfunction ↑BP response (>225/90) future hypertensive ↓SBP (exercise-induced hypotension) valve disease, CAD, LV dysfunction 1 CAD HR and BP ex response Delta Heart Rate Difference between resting and maximal HR response The lower the delta HR, the higher the mortality Pressure Pulse Product (Double Product) Double Product and coronary artery occlusion SBP x HR Index of myocardial oxygen consumption Cardiac Output, Stroke Volume Invasive measures: Swan-Ganz catheter is introduced into the pulmonary artery Cardiac Output vs. Work Rate Thompson 01, pg 5 Flow sensor: direct Fick Thermistor: thermal dilution Non-invasive measures: rebreathing techniques, continuous-wave Doppler 2 Normal Stroke Volume Response EDV and ESV during exercise SV = EDV -ESV In upright position, SV increases initially with exercise Cardiac Contractility Ejection Fraction EF = EDV - ESV / EDV ⌧resting value about 60% ⌧exercise value, increases to 80-85% ESV volume of blood left in the heart after contraction Why are VO2 measurements obtained? VO2 measurement is more reliable than estimates from cycle or treadmill eqns Peak VO2 is most accurate measurement of functional capacity and index of overall cardiopulmonary health Heart and lung diseases will be evident from gas exchange abnormalities Increase SV with exercise is due to ↑EDV and ↓ESV CAD CO, HR, and SV responses CAD patients may have constriction in coronary arteries Constriction causes ischemia and ↓pump fn Cardiac output may not rise normally SV may not increase normally HR response may be blunted (independent of drugs) and may even decrease Oxygen Consumption The most notable result of CAD is ↓VO2max variable response (depends on amount of myocardium involved and severity of ischemia) ↓ VO2 at submaximal levels of exercise oxygen kinetics are slower more reliance on anaerobic energy production during exercise 3 Maximal Exercise O2 variables Subject CAD Normal Athlete VO2 HR SV CO a-vO2 ml/min bpm l/min 1500 3000 5600 175 50 8.8 17.0 190 100 19.0 15.8 180 180 32.5 17.0 ml/b ml/dl Roberts 97, pg 109 Roberts 97, pg 106 Anaerobic threshold or ventilatory threshold Normal AT response AT has been described as the breakpt in Ve associated with lactate accumulation and muscle anaerobiosis AT probably reflects a balance between lactate production and removal Exercise beyond AT is associated with metabolic acidosis, hyperventilation, and reduced capacity to perform work AT response in CAD AT < 40%VO2max is below 95% confidence for sedentary subjects ↓ AT is assoc with CAD and is a sign of a condition that limits O2 flow to muscles Other tests are needed to differentiate whether problem is cardiovascular, respiratory or metabolic Wasserman86, pg 35 O2 pulse O2 pulse = VO2/HR O2 pulse = SV x a-vO2 difference With exercise, O2 pulse increases due to ↑ a-v O2 difference and SV (upright) In CAD, the rise in O2 pulse is blunted because SV is reduced 4 OAD = obstr airways disease HD = heart disease Skin Temperatures Skin temperatures measured on the chest Thermistors Thermoscan During angina, a cold area develops over the heart due to vasoconstriction Appears about 1 min before pain Wasserman 86, pg 37 Systolic Time Intervals Measure by Phonocardiogram Carotid pulse sensor Ballistocardiogram Prolonged STI could indicate coronary insufficiency, decreased ventricular function, increased TPR, abnormal wall motions Heart Sounds 1. A-V valves close at onset of systole, blood rumbling (lub) 2. Aortic then pulmonic valves close at onset of diastole (dub) 3. Rapid filling in early diastole, sound occurs with decreased ventricular distensibility 4. Atrial contraction Bad Heart Sounds Sound 1, should be loud and powerful Mitral murmur, prolapsed mitral leaflet (10% of pop) Sound 2, splitting may be LBBB and decreased right or left ventricle function Aortic murmur, aortic stenosis Sound 3, associated with poor ventricular function Sound 4, common in ischemic heart disease or myocardial disease. Conclusions: The predictive value of exercise testing is improved by considering exercise responses in addition to EKG Reduced VO2max Blunted hemodynamic response Lowered AT Lowered O2 pulse Prolonged STI Unusual sounds or palpations 5
