Technical Note: Informatics
Data Analysis: Microarray Gene Expression
An overview of data processing using the NextBio platform for gene expression analysis.
Introduction
Expression Summarization
The Illumina NextBio library contains over 113,000 biosets obtained
by mining the vast amounts of publicly available genomic data from
sources such as the Gene Expression Omnibus, ArrayExpress, and
other repositories. These data go through a systematic screening,
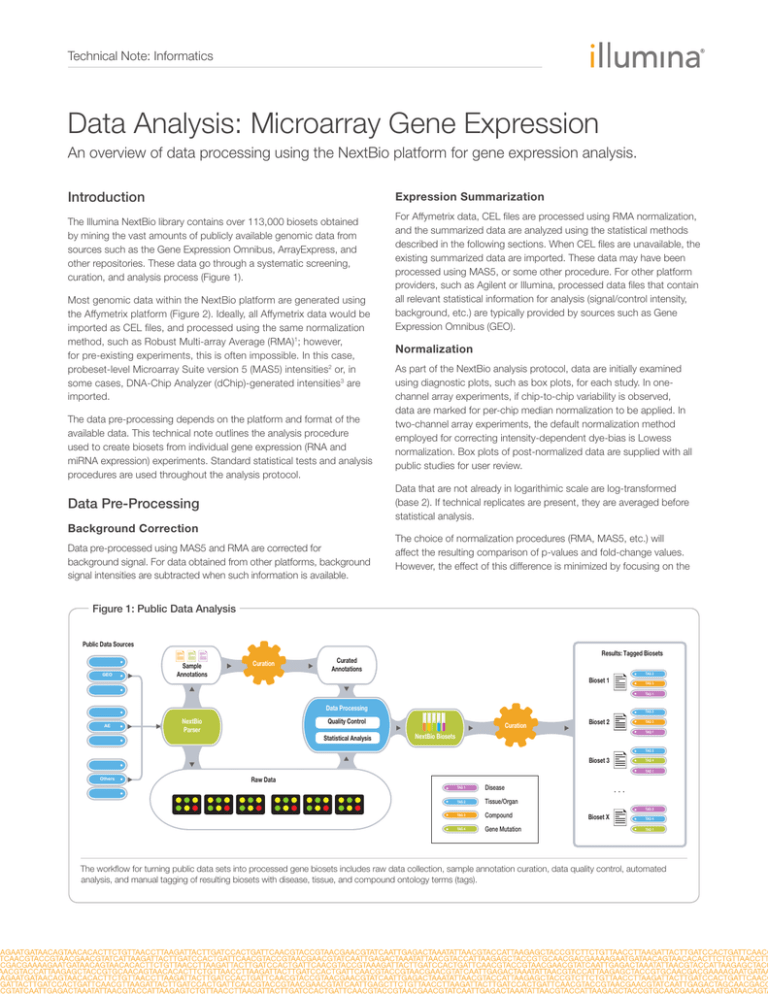
curation, and analysis process (Figure 1).
Most genomic data within the NextBio platform are generated using
the Affymetrix platform (Figure 2). Ideally, all Affymetrix data would be
imported as CEL files, and processed using the same normalization
method, such as Robust Multi-array Average (RMA)1; however,
for pre-existing experiments, this is often impossible. In this case,
probeset-level Microarray Suite version 5 (MAS5) intensities2 or, in
some cases, DNA-Chip Analyzer (dChip)-generated intensities3 are
imported.
The data pre-processing depends on the platform and format of the
available data. This technical note outlines the analysis procedure
used to create biosets from individual gene expression (RNA and
miRNA expression) experiments. Standard statistical tests and analysis
procedures are used throughout the analysis protocol.
For Affymetrix data, CEL files are processed using RMA normalization,
and the summarized data are analyzed using the statistical methods
described in the following sections. When CEL files are unavailable, the
existing summarized data are imported. These data may have been
processed using MAS5, or some other procedure. For other platform
providers, such as Agilent or Illumina, processed data files that contain
all relevant statistical information for analysis (signal/control intensity,
background, etc.) are typically provided by sources such as Gene
Expression Omnibus (GEO).
Normalization
As part of the NextBio analysis protocol, data are initially examined
using diagnostic plots, such as box plots, for each study. In onechannel array experiments, if chip-to-chip variability is observed,
data are marked for per-chip median normalization to be applied. In
two-channel array experiments, the default normalization method
employed for correcting intensity-dependent dye-bias is Lowess
normalization. Box plots of post-normalized data are supplied with all
public studies for user review.
Data that are not already in logarithimic scale are log-transformed
(base 2). If technical replicates are present, they are averaged before
statistical analysis.
Data Pre-Processing
Background Correction
Data pre-processed using MAS5 and RMA are corrected for
background signal. For data obtained from other platforms, background
signal intensities are subtracted when such information is available.
The choice of normalization procedures (RMA, MAS5, etc.) will
affect the resulting comparison of p-values and fold-change values.
However, the effect of this difference is minimized by focusing on the
Figure 1: Public Data Analysis
Public Data Sources
GEO
Sample
Annotations
Curation
Results: Tagged Biosets
Curated
Annotations
TAG 2
Bioset 1
TAG 3
TAG 1
Data Processing
AE
NextBio
Parser
TAG 2
Quality Control
Statistical Analysis
Curation
Bioset 2
TAG 3
TAG 1
NextBio Biosets
TAG 2
Bioset 3
TAG 4
TAG 1
Others
Raw Data
TAG 1
Disease
TAG 2
Tissue/Organ
TAG 3
Compound
TAG 4
Gene Mutation
. . .
TAG 2
Bioset X
TAG 4
TAG 1
The workflow for turning public data sets into processed gene biosets includes raw data collection, sample annotation curation, data quality control, automated
analysis, and manual tagging of resulting biosets with disease, tissue, and compound ontology terms (tags).
Technical Note: Informatics
Figure 2: Bioset Compositions
Figure 3: Box Plot of Sample Intensities
Proportion of NextBio platform biosets from various platforms and species
(as of June 2008).
resulting ranking of elements (which should be more invariant across
different normalization procedures). That is, for a given experiment
and treatment factor within that experiment, the elements that are
most affected by the factor will rank fairly high, regardless of which
underlying normalization was used. This information is used to
construct the bioset. In addition, ranks enable comparison of data with
different types of absolute values—e.g., protein abundance data with
gene expression signatures or with sets of RNAi targets producing
positive hits in phenotypic assays.
Data Visualization and Quality Control
To examine data quality and experimental design assumptions further,
hierarchical clustering of samples is used to assess separation of
samples visually, according to the treatment or test factors. If good
separation is not seen for each factor of interest (i.e., factors that the
experiment was designed to test), it is an indicator that the data may
not be good enough to construct reliable biosets. These analyses, as
well as the box plot analysis (Figure 3), are also used to identify “bad”
or “outlier” samples. The determination on whether to exclude any
samples is made on a case-by-case basis.
b. The number of negative datapoints (fails quality control if
this number is > 10% of number of datapoints). Negative
signal intensities in the data are corrected by either: i) setting
all negative values to the smallest positive signal intensity
(default); or ii) shifting signal intensities up by a constant so that
the smallest value is positive.
c. The distribution of the signal intensities in terms of [0%, 25%,
50%, 75%, 100%]-quantiles.
In addition, an analysis of variance (ANOVA) F test is performed to
compare the various factors (i.e., treatment or control groups) in
the study. At a minimum, the number of genes showing significant
changes must exceed the number expected by chance. A histogram
of the ANOVA p-value distribution (Figure 4) is generated and
examined for concordance with the expected distribution for a study
with statistically significant results (i.e., disproportionately lower
p-values). This figure is also associated with each public data set for
users to validate the significance of the study results.
Several data quality metrics are reported for every data set to enable
the assessment of data quality. These include:
a. The number of missing values per sample (flagged if it is > 2%
of number of probes/genes in any sample). Missing values are
not replaced.
Figure 4: Data set Analysis Examples
Histograms of ANOVA F-test p-values for data sets of good quality (left panel) and poor quality (right panel). The p-values are grouped into 50 bins and plotted
against the number of genes in each bin. The left panel graph indicates a subset of genes that show differential expression.
Technical Note: Informatics
Data Filtering and Differential Expression
Analyses
For each parameter of interest in the study, the following comparison
procedure is used.
1. Signal quality: Genes are filtered to eliminate low-quality and less
reliable measurements. The filtering is based on raw expression
signal (after RMA or MAS5 processing for Affymetrix data). For
each comparison (e.g., treated vs. control) the signal intensity
must be above a certain threshold level of intensity in at least one
of the two groups being compared. The threshold is calculated as
the 20th percentile of all raw (probeset-level) measurements.
2. Comparisons: Samples are grouped by curators, depending on
the parameter of interest. The following guidelines apply:
a. In a time series study, all time points are compared against the
zero time point.
b. In studies with one or more treatments, all treatments are
compared against the control.
c. If the study involves investigating a disease vs. normal state,
the disease samples are compared against normal samples.
For studies investigating benign vs. primary vs. metastatic
cancer, each cancer state is compared against benign,
because benign is the closest to normal.
3. Statistical tests: When comparing independent samples, a twosample t test is performed on each gene, comparing the treated
group to the control group (a one-sample t test is applied when
there are no control samples). The Welch t test is used by default,
when variances cannot be assumed to be equal. When comparing
paired samples, a paired t test is performed.
4. Gene filtering: Except for tissue atlas biosets where the full gene
signature is presented to the user, genes in all other biosets are
filtered using a p-value cutoff of 0.05, with no multiple-testing
correction. The resulting set of genes is further filtered using a
fold-change difference cutoff between the average intensity in
test and control groups. Typically, the NextBio platform considers
fold changes ≥ 1.2 based on microarray technology sensitivity,
but the choice may also depend on the type of experiment,
tissue source, and other factors. For example, changes in many
cell lines, certain treatment types, or brain tissues can be a lot
smaller than changes in blood cells of trauma patients. In this
case, the cutoffs can be adjusted accordingly. Volcano plots
can be used to evaluate fold-change cutoff thresholds using
distribution of fold changes within a given comparison. For more
“noisy” tissues (e.g., tumor, blood), cutoffs are more stringent
relative to other types of samples. While the choice of foldchange cutoff is not an exact science, choices are limited to a
small range that depends on the experimental context.
Constructing a Bioset
The resulting final list of genes is used to construct the bioset, as
shown in Figure 5. The bioset consists of the list of genes, along with
associated p-value, fold change, and average expression level in each
treatment group, for each gene. In addition, a short description of the
bioset and a summary of the analysis performed can also be included
in the file to be uploaded. All biosets in the NextBio library contain
this information, which can be viewed on the bioset information page
through the web interface.
For rank-based meta-analyses, the NextBio platform uses standard
fields in the column headers to rank features in the bioset. If more than
Figure 5: Gene List Example
Sample bioset from drug vs. control microarray samples analysis from A549 cell lines treated with rosiglitazone. In this example, the “fold change” column is selected
for ranking during bioset import into the NextBio platform. Supplemental information columns can be included as custom columns with user-defined titles (currently,
a maximum of five columns) to provide average expression level information in treated and control groups for interested users.
Technical Note: Informatics
one standard statistical column is present, the NextBio platform picks
one of the columns for ranking in the following order:
Tagging Biosets with Ontology Terms
During data import, the ranking criterion column is thus selected, and
consequent mapping of all probesets to gene references (NCBI Gene
ID) takes place.
The final step in preparing data for use in the NextBio platform
is the tagging of biosets with standard ontology terms reflecting
disease, tissue, treatment, experimental design, and sample
source (Figure 1). This step is important and provides a semantic
backbone to all of the analyzed data. This enables the NextBio
computational engine to perform additional high-level correlations,
and also makes it easier for users to find relevant data sets.
Comprehensive ontologies cover anatomy (Foundation Model of
Anatomy [FMA]/Medical Subject Headings [MeSH]5), diseases
(SNOMED Clinical Terms [CT]6), and compounds (over 8 million
compound clusters and associated structures).
A multiple-testing correction is not used for the following reasons:
References
1. As stated in the introduction, a bioset within the NextBio analysis
pipeline should include all potentially interesting results, and so
the emphasis is on reducing false negatives (at the expense of
including some false positives).
1. Irizarry RA, Hobbs B, Collin F, Beazer-Barclay YD, Antonellis KJ, et al. (2003)
Exploration, normalization, and summaries of high density oligonucleotide
array probe level data. Biostatistics 4: 249–264.
• Fold change
• p-value
• Score (this can represent any scoring measure determined by the
analyst)
• Rank
• Correlation
2. Meta-analysis is based only on rank, not level of significance, and
p-value ranking is not affected by multiple testing corrections.
In case of data generated by the NextBio platform, most of the ranks
are based on fold-change values. When comparing biosets generated
from different experiments, fold change is used as the default ranking
as it has been shown to give better concordance across platforms
than p-values from statistical tests4. In certain types of analysis
comparing multiple conditions, the p-value is the only choice of
statistics that could be used for ranking. In this case, the p-value will
be selected as the metric to be used for ranking during data import
into the NextBio platform when the fold-change column is absent.
2. www.affymetrix.com/support/technical/byproduct.affx?product=mas
3. Li C, Wong WH (2001) Model-based analysis of oligonucleotide arrays:
expression index computation and outlier detection. Proc Natl Acad Sci
USA 98: 31–36.
4. Shi L, Tong W, Fang H, Scherf U, Han J, et al. (2005) Cross-platform
comparability of microarray technology: intra-platform consistency and
appropriate data analysis procedures are essential. BMC Bioinformatics
15 (6 Suppl 2): S12.
5. sig.biostr.washington.edu/projects/fm/AboutFM.html
6. www.ihtsdo.org/snomed-ct/
Illumina • 1.800.809.4566 toll-free (U.S.) • +1.858.202.4566 tel • techsupport@illumina.com • www.illumina.com
FOR RESEARCH USE ONLY
© 2014 Illumina, Inc. All rights reserved.
Illumina, NextBio, the pumpkin orange color, and the Genetic Energy streaming bases design are trademarks or registered
trademarks of Illumina, Inc. All other brands and names contained herein are the property of their respective owners.
Pub. No. 970-2014-010 Current as of 07 August 2014


