Dumptown, USA: Making a Ton of Difference: PDF
advertisement

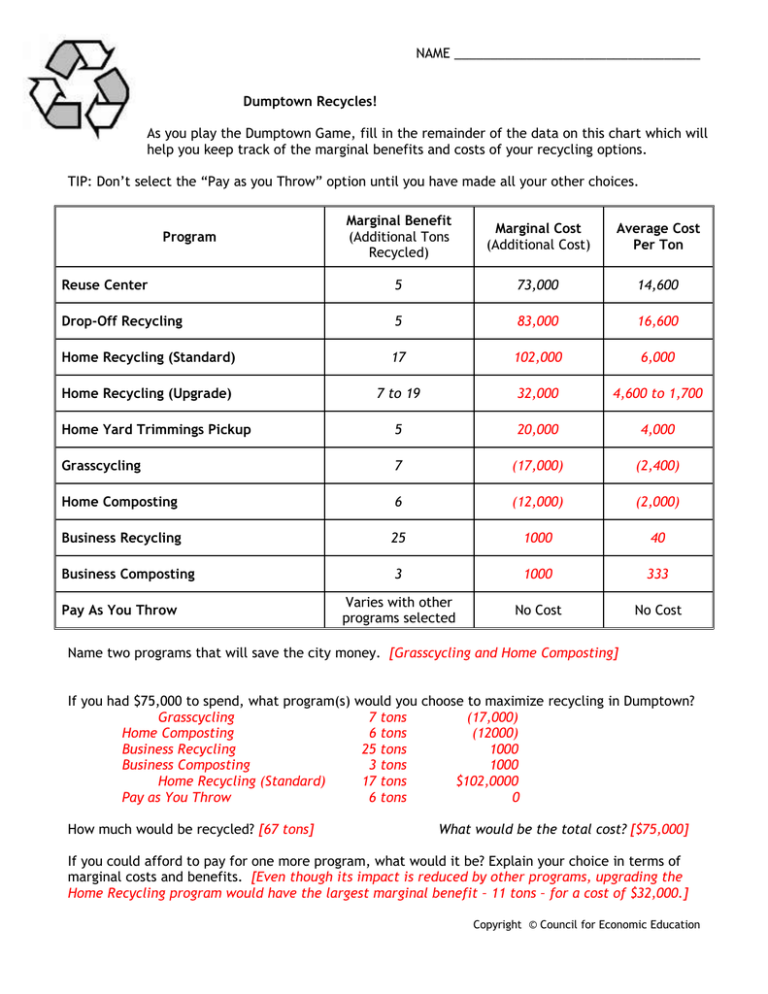
NAME __________________________________ Dumptown Recycles! As you play the Dumptown Game, fill in the remainder of the data on this chart which will help you keep track of the marginal benefits and costs of your recycling options. TIP: Don’t select the “Pay as you Throw” option until you have made all your other choices. Marginal Benefit (Additional Tons Recycled) Marginal Cost (Additional Cost) Average Cost Per Ton Reuse Center 5 73,000 14,600 Drop-Off Recycling 5 83,000 16,600 Home Recycling (Standard) 17 102,000 6,000 Home Recycling (Upgrade) 7 to 19 32,000 4,600 to 1,700 Home Yard Trimmings Pickup 5 20,000 4,000 Grasscycling 7 (17,000) (2,400) Home Composting 6 (12,000) (2,000) Business Recycling 25 1000 40 Business Composting 3 1000 333 Varies with other programs selected No Cost No Cost Program Pay As You Throw Name two programs that will save the city money. [Grasscycling and Home Composting] If you had $75,000 to spend, what program(s) would you choose to maximize recycling in Dumptown? Grasscycling 7 tons (17,000) Home Composting 6 tons (12000) Business Recycling 25 tons 1000 Business Composting 3 tons 1000 Home Recycling (Standard) 17 tons $102,0000 Pay as You Throw 6 tons 0 How much would be recycled? [67 tons] What would be the total cost? [$75,000] If you could afford to pay for one more program, what would it be? Explain your choice in terms of marginal costs and benefits. [Even though its impact is reduced by other programs, upgrading the Home Recycling program would have the largest marginal benefit – 11 tons – for a cost of $32,000.] Copyright © Council for Economic Education


