Journal of Magnetism
and Magnetic
Materials
1044107
(1992)
1002-1004
North-Holland
Magneto-optical
phases of Fe-Pt
Kerr rotation
alloy films
T. Katayama “, T. Sugimoto
and J.C. Lodder ”
The magneto-optical
‘, Y. Suzuki
Kerr rotation (0,)
alloy films. The
increasing
SO at%
however,
all the 0,
by the anti-parallel
approx. 50 at?
until about
‘, M. Hashimoto
/ 0, 1 in
as-deposited
and disordered
“, P. de Haan ”
have been measured
(disordered)
in ordered
and disordered
films becomes gradually
larger with
Fe, but the shape of 0 k spectra does not change so much. After annealing,
spectra were changed. A considerable change of the Ok spectra near 300 nm. which would be expected
alirhment
Fe.
of the polarized
Pt soins to Fe spins after
% lYY2
annealing.
was not ohserved
in the films with
_
Recently, considerable
attention
has been focused
to the 3d-metals/Pt
multilayers
because they have a
potential as magneto-optical
recording media [1,2]. For
the applications,
a large magneto-optical
Kerr effect is
required. So far, many studies have been done on the
magneto-optical
Kerr effect of Co/Pt and Co/Pd multilaycrs [I-S]. In general, the wavelength
dependence
multilayers
of 8k (0, spectra) of the 3d-metals/Pt
bear much resemblance
to that of the corresponding
disordered
alloy [5,6]. It is also found that there is
some different
in fIK spectra between
ordcrcd
and
disordered
phases in these alloys. However, only a few
researches
have reported
on the Kerr effect in these
alloys [5.6]. Especially. 0k spectra of ordered phases of
these alloys has hardly been investigated.
In this paper,
OK spectra and the related properties
have been measured in ordered and disordered
phases of Fe-Pt alloy
films.
The samples were prepared
onto glass or quartz
substrates
by means of RF sputtering
using tip-ontargets. 0k spectra were measured with a Kerr rotation
spectrometer
from 250 to 800 nm. The incident angle
of the light beam was lo”. An annealing
step was
carried out with an electric furnace in pure H, gas.
Saturation
magnetization
(MS) was measured
with
SQUID at 5 and 295 K. Structural changes were examined with X-ray diffraction.
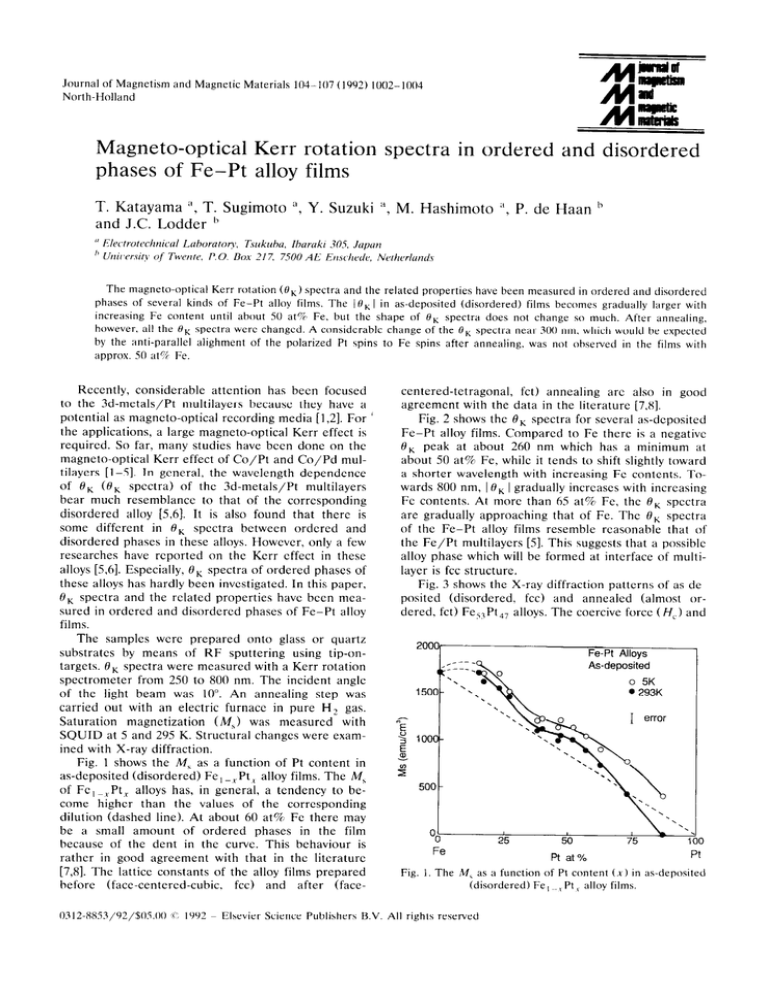
Fig. 1 shows the M, as a function of Pt content in
as-deposited
(disordered)
Fe, _.Pt I alloy films. The MS
of Fc , ~, Pt, alloys has, in general, a tendency to become higher than the values of the corresponding
dilution (dashed line). At about 60 at% Fc there may
be a small amount of ordered
phases in the film
because of the dent in the curve. This behaviour
is
rather in good agreement
with that in the literature
[7,8]. The lattice constants of the alloy films prepared
before
(face-centered-cubic.
fee) and after
(face0312.X853/92/$05.00
in ordered
spectra and the related properties
phases of several kinds of Fe-R
Fe content
spectra
Elsevier
Science Publishers
centered-tetragonal,
fct) annealing
arc also in good
agreement with the data in the literature [7,8].
Fig. 2 shows the @k spectra for several as-deposited
Fe-Pt alloy films. Compared to Fe there is a negative
8k peak at about 260 nm which has a minimum at
about 50 at% Fe, while it tends to shift slightly toward
a shorter wavelength with increasing Fc contents. Towards 800 nm, 1OKI gradually increases with increasing
Fe contents. At more than 65 at% Fe, the OK spectra
are gradually approaching
that of Fe. The OK spectra
of the Fe-Pt alloy films resemble reasonable
that of
the Fe/Pt multilayers [S]. This suggests that a possible
alloy phase which will be formed at interface of multilayer is fee structure.
Fig. 3 shows the X-ray diffraction patterns of as-deposited
(disordered,
fee) and annealed
(almost ordered. fct) Fe,,Pt 47 alloys. The coercive force ( H,) and
Fe-Pt Allovs
o 5K
l 293K
1500
1
nE
2
E
ar
100
r”
500
I
OO
_
25
50
Pt
Fig. 1. The M, as a function of Pt content (x)
(disordered)
B.V. All rights reserved
Fe
, ~,Pt ,
in as-deposited
alloy films.
1003
T Katayama et al. / Magneto-optxal Kerr rotation in Fe-Pt films
c
As-deposited
Pt-Fe Alloys
3
20
WAVELENGTH.
h
( nm)
Fe s3Pt4, Alloy
3
20-
:
10 -
5
F:
WAVELENGTH,
h ( nm
)
0
5.g -10
;:;;~:~~~r
&
Fig.
2. The
0 K spectra
for several kinds
(disordered)
Fe-Pt alloys.
of as-deposited
the axis ratio c/a in the ordered phase are about 7
kOe and 0.95, respectively.
These values are in good
agreement
with those in the literature [7,8]. However,
since the M, value is somewhat higher than that in the
literature [7,8], the phase transition to fct phase might
not occur completely in this alloy.
Fig. 4 shows the 01, spectra for disordered
and
ordered phases in Fe,,Pt,,
alloys as an example. 1eK 1
after annealing is smaller than that of the as-deposited
one. Although a larger decrease of MS after annealing
is clearly observed, we do not see a large change of the
1e53Pt47Alloy
f.c.c.
Co-K (Y
(111)
As-deposited
-40 -
Fig. 4. The OK spectra
for disordered
and ordered
Fe,,Pt,,
alloys.
phases
in
near 300 nm, which would be expected
if
the anti-parallel
alignment of the polarized Pt spins to
the Fe spins [8] after annealing
would occur. The
decrease of MS is explainable by a change of the spin
structure since it was reported
that the polarized
Pt
spins aligned in anti-parallel
to Fe spins in ordered fct
alloys near 50 at% Fe [7,8]. However, the difference of
OK spectrum can not be explained simply by a change
of spin structure. This suggests that there is also possible a difference
in the electronic
structure
between
ordered
and disordered
states. Fig. 5 shows the 0,
spectra of disordered
and ordered Fe,,Pt,,
alloy films
as another example. There is much difference between
as-deposited
and annealed ones. The considerable
decrease of 0, is thought to be originated
from the
change of spin structure by annealing in which the Fe
spins align anti-parallel
to each other [8].
As a conclusion,
it is found that 1OK1 in as-deposited films becomes gradually larger with increasing
Fe content until about 50 at% Fe, but the shape of 0,
spectra shows the same tendency.
After annealing,
OK spectra
Annealed
600°C -25hrs
60
80
1
26 Ml
Fig. 3. The X-ray diffraction
patterns
of as-deposited
(disordered,
fee) and annealed
(almost ordered,
fct) Fe,,Pt,,
alloy. Annealing was carried out at 600 o C for 25 h.
Fig.
5. The
OK spectra
of as-deposited
annealed (ordered) Fe,,Pt,,
(disordered)
alloy.
and
1004
T. Katayama
et al. / Magneto-optical
however, all the eK spectra were different. A considerable change of the OK spectra near 300 nm, which
would be expected by the polarized Pt spins to Fe spins
after annealing,
was not observed
between
as-deposited and annealed films with approximately
50 at%
Fe. One (T.K) of the authors wish to thanks gratefully
to The Netherlands
Organization
of Scientific
Research (NW01 for financial support of the staying at
University of Twente.
References
[ll W.B. Zeper et al., J. Appl. Phys. 65 (1989) 4971.
[2] S. Hashimoto
et al.. J. Appl. Phys. 67 (1990) 2136
Kerr rotation in FePt
films
[3] K. Nakamura
et al., IEEE Trans. on Magn. MAG-25
(1989) 3758.
[4] E.R. Moog, J. Zak et al., J. Appl. Phys. 69 (1991) 880.
[5] T. Sugimoto et al., Jpn. J. Appl. Phys. 28 (1989) 2333.
[61 K.H.J. Buschow et al., J. Magn. Magn. Mater. 38 (1983) I.
[7] L. Grafu, A. Kussmann
and M. Fallot, Ann. Phys. IO
(1938) 291.
[8] A.Z. Men’shiko et al., Fiz. Metalloved.
38 (1974) 505.


