Permeability Measurement: Klinkenberg Effect & Gas Permeameter
advertisement

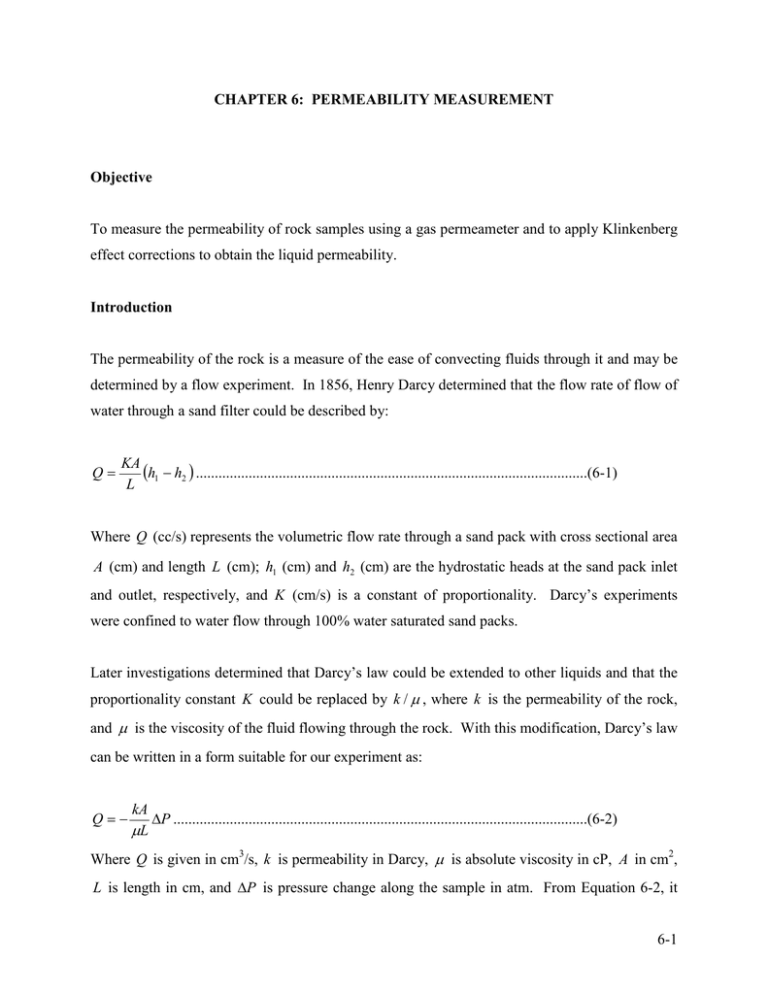
CHAPTER 6: PERMEABILITY MEASUREMENT Objective To measure the permeability of rock samples using a gas permeameter and to apply Klinkenberg effect corrections to obtain the liquid permeability. Introduction The permeability of the rock is a measure of the ease of convecting fluids through it and may be determined by a flow experiment. In 1856, Henry Darcy determined that the flow rate of flow of water through a sand filter could be described by: Q= KA (h1 − h2 ) ........................................................................................................(6-1) L Where Q (cc/s) represents the volumetric flow rate through a sand pack with cross sectional area A (cm) and length L (cm); h1 (cm) and h2 (cm) are the hydrostatic heads at the sand pack inlet and outlet, respectively, and K (cm/s) is a constant of proportionality. Darcy’s experiments were confined to water flow through 100% water saturated sand packs. Later investigations determined that Darcy’s law could be extended to other liquids and that the proportionality constant K could be replaced by k / µ , where k is the permeability of the rock, and µ is the viscosity of the fluid flowing through the rock. With this modification, Darcy’s law can be written in a form suitable for our experiment as: Q=− kA ∆P ..............................................................................................................(6-2) µL Where Q is given in cm3/s, k is permeability in Darcy, µ is absolute viscosity in cP, A in cm2, L is length in cm, and ∆P is pressure change along the sample in atm. From Equation 6-2, it 6-1 can be seen that when a 1 cP viscosity fluid flows at 1 cm3/s through a sample of cross sectional area of 1 cm2 and length of 1 cm under a pressure change of 1 atm the porous medium has a permeability of 1D. Klinkenberg Effect Permeability is a property inherent to the rock and do not depend on the type of fluid used to measure it. This is true for non-reactive liquid. However, Klinkenberg in 1941 found that the permeability measurements on a core sample were not constant when using gases as the fluid, but varied with the gas used to make the measurement, as well as the mean (average) pressure existing in the core at the time of the measurement. When liquid flows through tubes, the velocity profile is maximum at the center of the tube and zero at the wall due to viscous forces. This does not happen with gas flowing at low pressures. The gas molecules are in constant motion traveling back and forth a distance called the “mean free path”. When the pressure is low the mean free path distance is large enough so that no gas molecules will collide against the walls during some small periods of time. This effect reduces the friction loss at the wall increasing the ease with the gas flows through the tube. This same effect occurs in the porous space of rock and as consequence measured permeability appear to be higher than it really is. As pressure is increased the “mean free path” of the gas molecules becomes smaller and more molecules collide with the wall increasing the friction losses and the measured permeability tends to the true absolute permeability. Klinkenberg effect is only important at laboratory conditions where permeability is generally measure at low pressures. The permeability to gas ( k g ) is related to the mean pressure at measurement ( P ) and liquid permeability ( k l ) as follows: b k g = k l 1 + ..........................................................................................................(6-3) P where the coefficient b is determined empirically and depends on pore size of the rock and the type of gas used for measurement. Equation 6-3 suggests that a plot of gas permeability vs. 1/ P is a straight line. As shown in Figure 6-1, as mean the pressure increases, the permeability 6-2 approaches the liquid permeability. Note that for a given rock sample, regardless the type of gas used, the same permeability to liquid is obtained. Figure 6-1. Klinkenberg Effect (Amyx et al, 1960) Gas Permeameter Figure 6-2 is a picture of a gas permeameter composed of a pressure gauge (center), gas rotometers (tubes to your left), pressure regulator (down to your right), and a core holder (down center). The instructions to use this device can be outline as follows: Mount a clean, dry core in a rubber sleeve of the appropriate size so the core and sleeve completely fill the core holder. Place the core and sleeve in the core holder and tighten it securely into place. Turn the flow tube selector valve to a large setting. Apply an upstream pressure 0f 0.25 atm to the system by adjusting the regulator. Tap the pressure gauge lightly during adjustment to stabilize the needle. The preferred range on the flow tube is between 20 and 140 divisions. If it remains below 20, the selector valve should be slowly turned to the medium setting. Record barometric pressure (mmHg, corrected for temperature and latitude), pressure (atm), gas temperature (oC) and flow rate tube reading (cm). 6-3 Repeat steps 3 through 6 for pressures of 0.5, 0.75, 1.00 atm. Measure the core plug diameter and length in cm. Figure 6-2. Gas Permeameter (Ruska Permeameter Operating Manual) The flow rate in centimeters given by the permeameter at different pressures must be converted into cc/s using figures 6-3, 6-4, and 6-5 for pressures of 1.0, 0.5 and 0.25 atm, respectively. The gas viscosity is given in Figure 6-6 for air and N2 at the measurement temperature. Calculate the gas permeability of each reading using Equation 6-3 and find the liquid permeability using the Klinkenberg correction procedure. 6-4 Figure 6-3. Gas Flow Rate at 1.00 atm (Ruska Permeameter Operating Manual) 6-5 Figure 6-4. Gas Flow Rate at 0.5 atm (Ruska Permeameter Operating Manual) 6-6 Figure 6-5. Gas Flow Rate at 0.25 atm (Ruska Permeameter Operating Manual) 6-7 Figure 6-6. Gas Viscosity Vs. Temperature (Ruska Instrument Manual) Laboratory Experiments Measure gas permeability at 0.25, 0.5, and 1.00 atm as explained in this chapter. Find the liquid permeability of the sample correcting by Klinkenberg effect. 6-8 References 1. Petroleum and Chemical Engineering Department, PETR 345 Lab Manual. Fall 1999. 2. API Recommended Practice for Core Analysis Procedure. API RP 40, American Petroleum institute, Dallas, 1960. 3. API Recommended Practice for Determining Permeability of Porous Media. API RP 27, American Petroleum institute, Dallas, 1956. 4. Monicard, R. P., Properties of Reservoir Rocks: Core Analysis. Gulf Publishing Co., Houston, TX (1980). 5. Special Core Analysis, Core Laboratories, INC. Dallas (1976). 6. Ruska Permeameter Operating Manuals 1011-801, Ruska Instrumentation Corporation, Houston, TX. 7. Amyx, J.W., Bass, D.M., and Whiting R.L., Petroleum Reservoir Engineering, McGrawHill, New York, NY (1960). 8. Frick T.C., Petroleum Production Handbook, Vol II; Society of Petroleum Engineers, Dallas, TX (1962). 9. Engler, T.W., Fluid Flow in Porous Media – Notes of Class Petroleum Engineering 524 – Fall 2003. 6-9


