- Effect of permeability heterogeneity on flow x (m)
advertisement
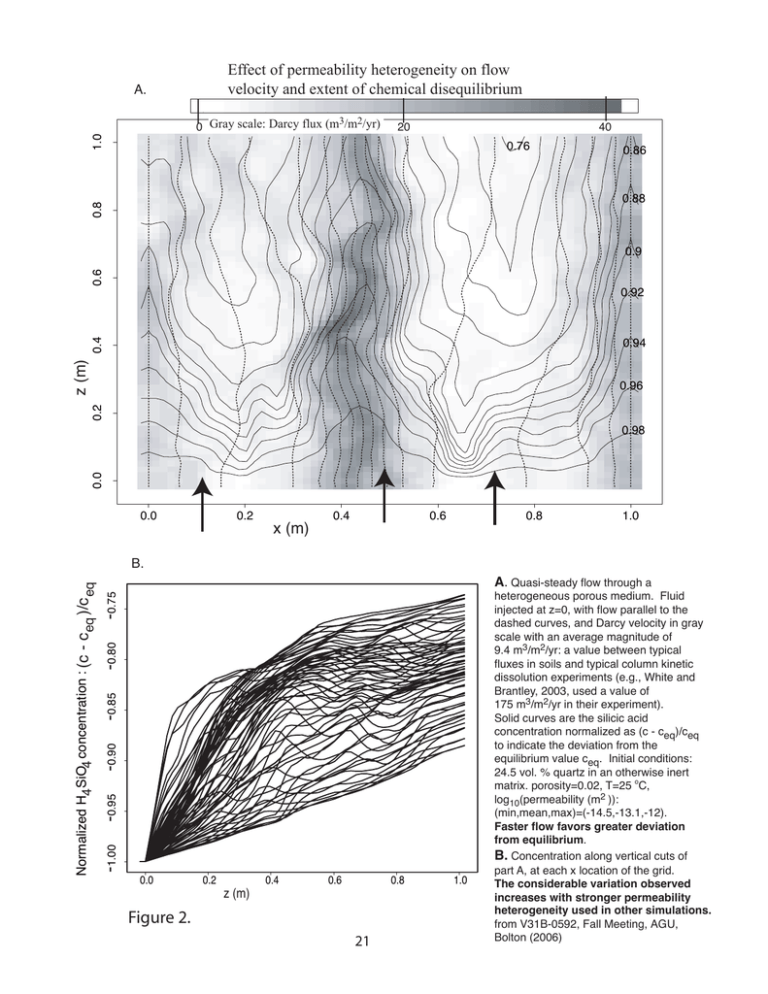
Effect of permeability heterogeneity on flow velocity and extent of chemical disequilibrium A. 1.0 3 2 0 Gray scale: Darcy flux (m /m /yr) 20 0.76 40 0.86 0.8 0.88 0.6 0.9 0.92 z (m) 0.4 0.94 0.2 0.96 0.0 0.98 0.0 0.2 x (m) 0.4 0.6 0.8 -1.00 -0.95 -0.90 -0.85 -0.80 -0.75 Normalized H4 SiO4 concentration : (c - c )/c eq eq B. 0.0 0.2 z (m) 0.4 0.6 0.8 Figure 2. 21 1.0 1.0 A. Quasi-steady flow through a heterogeneous porous medium. Fluid injected at z=0, with flow parallel to the dashed curves, and Darcy velocity in gray scale with an average magnitude of 9.4 m3/m2/yr: a value between typical fluxes in soils and typical column kinetic dissolution experiments (e.g., White and Brantley, 2003, used a value of 175 m3/m2/yr in their experiment). Solid curves are the silicic acid concentration normalized as (c - ceq)/ceq to indicate the deviation from the equilibrium value ceq. Initial conditions: 24.5 vol. % quartz in an otherwise inert matrix. porosity=0.02, T=25 oC, log10(permeability (m2 )): (min,mean,max)=(-14.5,-13.1,-12). Faster flow favors greater deviation from equilibrium. B. Concentration along vertical cuts of part A, at each x location of the grid. The considerable variation observed increases with stronger permeability heterogeneity used in other simulations. from V31B-0592, Fall Meeting, AGU, Bolton (2006)
