When Like Charges Attract: The Effects of Geometrical
advertisement
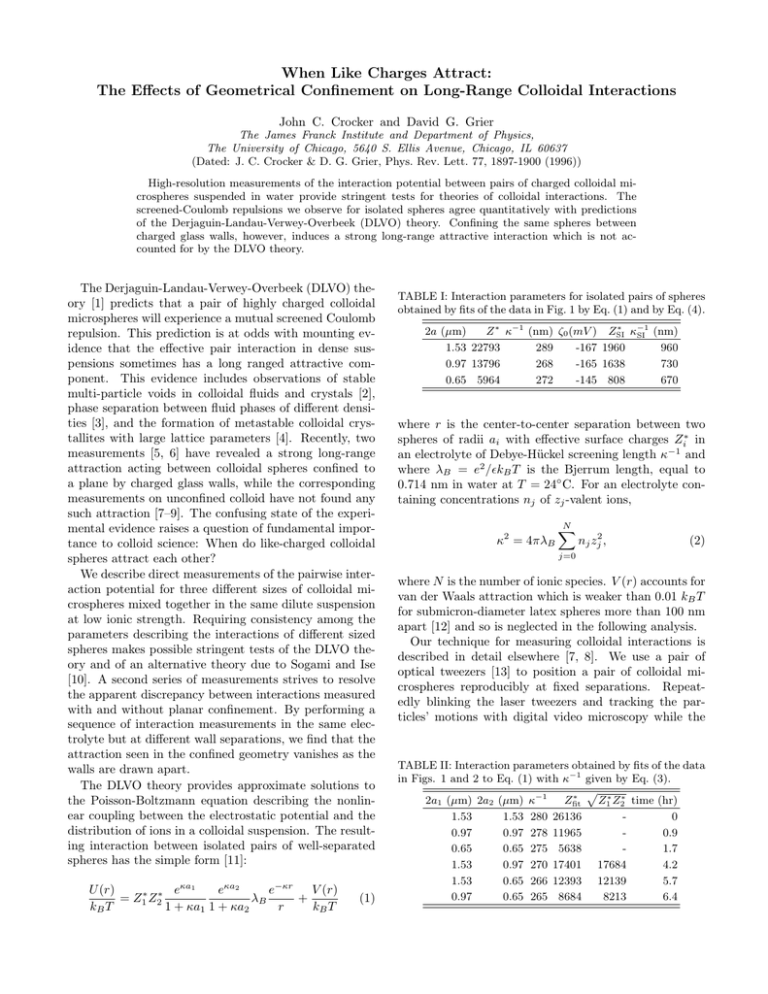
When Like Charges Attract: The Effects of Geometrical Confinement on Long-Range Colloidal Interactions John C. Crocker and David G. Grier The James Franck Institute and Department of Physics, The University of Chicago, 5640 S. Ellis Avenue, Chicago, IL 60637 (Dated: J. C. Crocker & D. G. Grier, Phys. Rev. Lett. 77, 1897-1900 (1996)) High-resolution measurements of the interaction potential between pairs of charged colloidal microspheres suspended in water provide stringent tests for theories of colloidal interactions. The screened-Coulomb repulsions we observe for isolated spheres agree quantitatively with predictions of the Derjaguin-Landau-Verwey-Overbeek (DLVO) theory. Confining the same spheres between charged glass walls, however, induces a strong long-range attractive interaction which is not accounted for by the DLVO theory. The Derjaguin-Landau-Verwey-Overbeek (DLVO) theory [1] predicts that a pair of highly charged colloidal microspheres will experience a mutual screened Coulomb repulsion. This prediction is at odds with mounting evidence that the effective pair interaction in dense suspensions sometimes has a long ranged attractive component. This evidence includes observations of stable multi-particle voids in colloidal fluids and crystals [2], phase separation between fluid phases of different densities [3], and the formation of metastable colloidal crystallites with large lattice parameters [4]. Recently, two measurements [5, 6] have revealed a strong long-range attraction acting between colloidal spheres confined to a plane by charged glass walls, while the corresponding measurements on unconfined colloid have not found any such attraction [7–9]. The confusing state of the experimental evidence raises a question of fundamental importance to colloid science: When do like-charged colloidal spheres attract each other? We describe direct measurements of the pairwise interaction potential for three different sizes of colloidal microspheres mixed together in the same dilute suspension at low ionic strength. Requiring consistency among the parameters describing the interactions of different sized spheres makes possible stringent tests of the DLVO theory and of an alternative theory due to Sogami and Ise [10]. A second series of measurements strives to resolve the apparent discrepancy between interactions measured with and without planar confinement. By performing a sequence of interaction measurements in the same electrolyte but at different wall separations, we find that the attraction seen in the confined geometry vanishes as the walls are drawn apart. The DLVO theory provides approximate solutions to the Poisson-Boltzmann equation describing the nonlinear coupling between the electrostatic potential and the distribution of ions in a colloidal suspension. The resulting interaction between isolated pairs of well-separated spheres has the simple form [11]: eκa1 V (r) U (r) eκa2 e−κr = Z1∗ Z2∗ λB + kB T 1 + κa1 1 + κa2 r kB T (1) TABLE I: Interaction parameters for isolated pairs of spheres obtained by fits of the data in Fig. 1 by Eq. (1) and by Eq. (4). 2a (µm) Z ∗ κ−1 (nm) ζ0 (mV ) 1.53 22793 289 -167 0.97 13796 268 -165 0.65 5964 272 -145 ∗ ZSI κ−1 SI (nm) 1960 960 1638 730 808 670 where r is the center-to-center separation between two spheres of radii ai with effective surface charges Zi∗ in an electrolyte of Debye-Hückel screening length κ−1 and where λB = e2 /kB T is the Bjerrum length, equal to 0.714 nm in water at T = 24◦ C. For an electrolyte containing concentrations nj of zj -valent ions, κ2 = 4πλB N X nj zj2 , (2) j=0 where N is the number of ionic species. V (r) accounts for van der Waals attraction which is weaker than 0.01 kB T for submicron-diameter latex spheres more than 100 nm apart [12] and so is neglected in the following analysis. Our technique for measuring colloidal interactions is described in detail elsewhere [7, 8]. We use a pair of optical tweezers [13] to position a pair of colloidal microspheres reproducibly at fixed separations. Repeatedly blinking the laser tweezers and tracking the particles’ motions with digital video microscopy while the TABLE II: Interaction parameters obtained by fits of the data in Figs. 1 and 2 to Eq. (1) with κ−1 given by Eq. (3). p ∗ ∗ ∗ 2a1 (µm) 2a2 (µm) κ−1 Zfit Z1 Z2 time (hr) 1.53 1.53 280 26136 0 0.97 0.97 278 11965 0.9 0.65 0.65 275 5638 1.7 1.53 0.97 270 17401 17684 4.2 1.53 0.65 266 12393 12139 5.7 0.97 0.65 265 8684 8213 6.4 2 12 10 2a: 1.53 µm 0.97 µm 0.65 µm 8 6 U(r)/ kBT U(r)/ kBT 12 10 4 2 0 -2 2 2a1: 2a2: 1.53 0.97 µm 1.53 0.65 µm 0.97 0.65 µm 8 6 4 2 3 4 5 6 0 -2 2.5 7 3.0 3.5 10 1 kB T 1 2.0 2.5 3.0 3.5 4.0 r (µm) 4.5 5.0 FIG. 1: (Top) Pairwise interaction potentials for three different populations of colloidal microspheres measured in the same electrolyte. The different data sets are offset by 1kB T for clarity. Curves are fits to Eq. (1) with parameters given in Tables I and II. (Bottom) Data replotted to emphasize the screened Coulomb functional form of the interaction. traps are off allows us to sample and numerically solve the master equation for the equilibrium pair distribution function, g(r) with 50 nm spatial resolution. The interaction potential U (r) can then be calculated (up to an additive offset) from the Boltzmann distribution, U (r) = −kB T ln [g(r)]. Roughly 4 × 10⁴ images of sphere pairs made over a range of tweezer separations are required to produce a single interaction curve with an energy resolution of 0.1 kB T . The data set for a typical potential curve is collected using 4 or 5 different pairs of nominally identical spheres at several different locations in the sample volume. Repeatability of our results and the continuity of individual curves suggest both that the populations of spheres are homogeneous and also that chemical conditions in the sample volume are uniform. We performed a series of such measurements on a a mixture of polystyrene sulfate spheres of diameters 0.652 ± 0.005 µm, 0.966 ± 0.012 µm, and 1.53 ± 0.02 µm dispersed in water [14]. The suspension was contained in r U(r)/ kBT (µm) r U(r)/ kBT (µm) r (µm) 4.0 4.5 r (µm) 5.0 5.5 10 1 kBT 1 2.5 3.0 3.5 4.0 r (µm) FIG. 2: (Top) Interaction potentials for isolated dissimilar pairs of spheres. Different data sets are offset by 1kB T for clarity. Curves are constrained fits to Eq. (1) with parameters given in Table II. (Bottom) Data replotted to emphasize the functional form of the interaction. a 2 × 1 × 0.005 cm3 sample volume formed by hermetically sealing the edges of a glass microscope cover slip to the face of a glass microscope slide. All surfaces were stringently cleaned before assembly and therefore developed a negative surface charge density on the order of one electron equivalent per 10 nm2 in contact with water [15]. The suspension was in diffusive contact, via holes drilled in the glass slide, with reservoirs of mixed bed ion exchange resin flushed with humidified Ar to minimize contamination by atmospheric CO2 . Finally, the sample temperature was regulated at T = 24.0 ± 0.1◦ C to ensure reproducibility of our results. Despite these precautions, glass surfaces act as a small virtual leak of ions. The screening length in the sample volume consequently decreases, κ−1 (t) ≈ κ−1 (0) (1 − αt) , (3) at a rate α which we estimate by comparing measurements over sufficiently long time intervals. Figure 1 shows U (r) measured for pairs of spheres from 3 10 U(r)/ kBT 8 6 4 a b c 2 0 d 1 2 3 4 r (µm) U(r)/ kBT each of the three populations. The optical tweezers were set to maintain the spheres more than 8 µmaway from the nearest glass wall throughout the measurements and in a region of the sample volume devoid of other spheres. Thus the data in Fig. 1 represent pairwise interaction potentials in the limit of infinite dilution. The curves in Fig. 1 are fits to Eq. (1) for the screening length κ−1 , the effective charge Z ∗ , and an additive offset. The fit parameters appear in Table I. All three data sets were obtained in the same electrolyte during a period of 4 h The fit values for the screening lengths are all consistent with κ−1 = 280 ± 15 nm, corresponding to a n = 1.2 × 10⁻⁶ M concentration of 1:1 electrolyte. To estimate α, we repeated the initial measurement on the 1.5 µmdiameter spheres after the 5 h interval in which data for the other size spheres were obtained. Assuming constant effective charge, we fit both data sets to Eq. (1) with values of Z ∗ constrained to be equal and obtain α = 0.009 ± 0.002 h−1 . This suggests that the electrolytic strength increases by 2 × 10⁻⁸ M h−1 , which can be accounted for by a flux of 3 ions nm−2 yr−1 from the walls. Substituting this result into Eq. (3) with κ−1 (0) = 280 nm and refitting the data in Fig. 1 for the two remaining free parameters results in the solid curves in Fig. 1. The constrained fit parameters appear in Table II. The dashed curves in Fig. 1 result from the unconstrained fits. While the constrained and unconstrained fits are barely distinguishable, the constrained fits facilitate comparison between values of Z ∗ obtained from the different data sets. The error in the estimate for Z ∗ in an individual data set is still roughly 25% because of the estimated 5% error in the figure for κ−1 (0), but the error in ratios of Z ∗ values is only about 5%. The data of Fig. 1 may also be used to test alternative theories of colloidal interactions, including the SogamiIse (SI) potential [10], 2 sinh κa κr e−κr USI (r) ∗2 = ZSI 1 + κa coth κa − λB . kB T κa 2 r (4) Equation (4) predicts a deep potential minimum at large separations for some conditions, although there are regimes where this minimum is small or nonexistent. Indeed, Eq. (4) provides satisfactory fits to the curves in Fig. 1. These fits, however, result in values for the screening length, κ−1 SI , which vary systematically with a. Variation in κ−1 SI is not likely to reflect drift in the electrolyte concentration since the control measurement yields a fit value for κ−1 SI within 10% of the tabulated value. This inconsistency provides compelling evidence that the SI theory does not correctly describe the interactions between isolated pairs of charged colloidal spheres. The effective charges Zi∗ can be related to the effective sphere surface potentials ζ0 by [11] eζ0 a ∗ Z = (1 + κa) , (5) kB T λB 14 12 10 8 6 4 2 0 -2 1 e f g h 2 3 r (µm) 4 5 FIG. 3: (Top) Interaction potentials for 2a = 0.97µm diameter spheres confined between parallel glass walls separated by (a) d = 6.5 ± 0.5 µm, (b) 4.0 ± 0.3 µm, (c) 3.5 ± 0.3 µm (d) 2.6 ± 0.3 µm. (Bottom) Confinement-induced attraction for two different sphere size populations measured in the same electrolyte. 2a = 1.53 µm: (e) unconfined, (f) d = 3.0 ± 0.5 µm; 2a = 0.97 µm: (g) unconfined, (h) d = 3.5 ± 0.5 µm. Curves are offset for clarity. In the limit of high surface charge density, both ζ0 and Zi∗ should saturate at finite values due to incomplete dissociation of the surface groups [16] and strong nonlinear screening near the sphere surfaces neglected in the DLVO theory [17]. In this limit, Eq. (5) reproduces both the roughly quadratic dependence of Z ∗ on a seen in Table II, and also the linear dependence predicted by the Poisson-Boltzmann cell model [18] in the limit κa 1. The linear superposition approximation (LSA) used in calculating Eq. (1) requires each sphere’s effective charge to be independent of the size and charge state of the other. We test the LSA’s validity in our system by measuring interactions between dissimilar spheres. Figure 2 presents such potentials measured immediately after the like-sphere measurements of Fig. 1. As before, the measured interactions are fit well by Eq. (1) and show no statistically significant attractive component. The ex- 4 tracted charge numbers, shown in Table II, agree well with the geometric means of the values for each of the spheres. Thus the DLVO theory successfully describes all six experimental curves with only five free parameters: κ−1 , α, and the three Zi∗ . The DLVO theory’s quantitative agreement with measurements on isolated spheres needs to be reconciled with reports of attractive interactions when spheres are confined by glass walls [5, 6]. We performed a series of measurements on a sample cell whose thin cover slip could be bowed inward by applying negative pressure. Figures 3(a)–3(d) show interaction curves for spheres of diameter 2a = 0.97 µm measured in different regions of the bowed sample volume with wall separations ranging from d = 6.5 ± 0.5 µm down to d = 2.6 ± 0.3 µm. We measured d at each location by focusing the laser traps onto the glass-water interfaces and estimate the wedge angle to be less that 10−3 rad. At the widest separation, spheres are free to roam in all three dimensions and the measured interaction potential follows the DLVO form with κ−1 = 100 ± 10 nm. In regions where d < 5 µm, the spheres are confined to the cell’s midplane by electrostatic interactions with the charged walls. Constancy of the sphere’s images suggests they move out of the focal plane by less than 150 nm. Under these conditions, an attractive minimum appears in the measured potential whose form is comparable to those previously reported [5, 6]. Repeated measurements such as those in Fig. 3 suggest that the as yet unexplained attractive interaction is stronger and longer ranged for larger spheres. When the wall separation is reduced to d = 2.6 ± 0.3 µm, the interaction potential changes once again to a purely repulsive form. We interpret Fig. 3(d) as resulting from the superposition of the DLVO repulsive core, the confinement-induced attraction (leading to the plateau in the curve), and an additional long-range repulsive interaction. Such a repulsion can be mediated by unscreened electric fields propagating through the nearby glass walls [19]. Data such as those in Fig. 3(a) demonstrate that mere proximity of the charged walls is not sufficient to induce attractive interactions. Attractions are only seen when the spheres are rigidly confined, and not otherwise. This coincidence suggests that strong coupling between the counterion clouds of the spheres and the walls is necessary to produce the observed attraction. The DLVO theory is not formulated for such conditions, and its failure is not surprising. Regardless of their explanation, these observations indicate a need to reinterpret experiments on colloidal suspensions in porous media and confined colloidal monolayers, particularly in the context of twodimensional melting. Attractive pairwise interactions would provide a nat- ural explanation for the anomalous phase behavior seen in dense colloidal suspensions [2–4]. Our measurements suggest that their origin is not to be found in the dilutelimit pair interaction, but do not rule out attractions mediated by many-body effects at finite volume fraction. Such an effect might be related to the unexplained attractions arising in the confined geometry, with the ensemble of spheres playing a similar role to the charged walls. We acknowledge valuable conversations with Tom Witten, Stuart Rice, Andy Marcus, and Seth Fraden. This work was supported by the National Science Foundation under Grant No. DMR-9320378. [1] B. V. Derjaguin and L. Landau, Acta Physicochimica (USSR) 14, 633 (1941); E. J. Verwey and J. Th. G. Overbeek, Theory of the Stability of Lyophobic Colloids (Amsterdam, Elsevier, 1948). [2] N. Ise and H. Matsuoka, Macromolecules 27, 5218 (1994). [3] B. V. R. Tata, M. Rajalakshmi, and A. Arora, Phys. Rev. Lett. 69, 3778 (1992); T. Palberg and M. Würth, Phys. Rev. Lett. 72, 786 (1994); B. V. R. Tata and A. K. Arora, Phys. Rev. Lett. 72, 787 (1994). [4] A. E. Larsen and D. G. Grier, Phys. Rev. Lett. 76, 3862 (1996). [5] G. M. Kepler and S. Fraden, Phys. Rev. Lett. 73, 356 (1994). [6] M. D. Carbajal-Tinoco, F. Castro-Román, and J. L. Arauz-Lara, Phys. Rev. E 53, 3745 (1996). [7] J. C. Crocker and D. G. Grier, J. Colloid Interface Sci. 179, 298 (1996). [8] J. C. Crocker and D. G. Grier, Phys. Rev. Lett. 73, 352 (1994). [9] K. Vondermassen, J. Bongers, A. Mueller, and H. Versmold, Langmuir 10, 1351 (1994). [10] I. Sogami and N. Ise, J. Chem. Phys. 81, 6320 (1984). [11] W. B. Russel, D. A. Saville and W. R. Schowalter, Colloidal Dispersions, (Cambridge University Press, Cambridge, 1989). [12] B. A. Pailthorpe and W. B. Russel, J. Colloid Interface Sci. 89, 563 (1982). [13] A. Ashkin, J. M. Dziedzic, J. E. Bjorkholm, and S. Chu, Opt. Lett. 11, 288 (1986). [14] Duke Scientific catalog numbers 5065A, 5095A, and 5153A. [15] R. K. Iler, The Chemistry of Silica, (Wiley, New York, 1972). [16] T. Gisler, S. F. Schulz, M. Borkovec, H. Sticher, P. Schurtenberger, B. D’Aguanno, and R. Klein, J. Chem. Phys. 101, 9924 (1994). [17] H. Löwen, P. A. Madden and J.-P. Hansen, Phys. Rev. Lett. 68, 1081 (1992); H. Löwen, J.-P. Hansen, and P. A. Madden, J. Chem. Phys. 98, 3275 (1993). [18] S. Alexander, P. M. Chaikin, P. Grant, G. J. Morales, P. Pincus, and D. Hone, J. Chem. Phys. 80, 5776 (1984). [19] F. H. Stillinger, J. Chem. Phys. 35, 1584 (1961).
