Algebra - Unit 5 Module 1 - Performance Task
advertisement
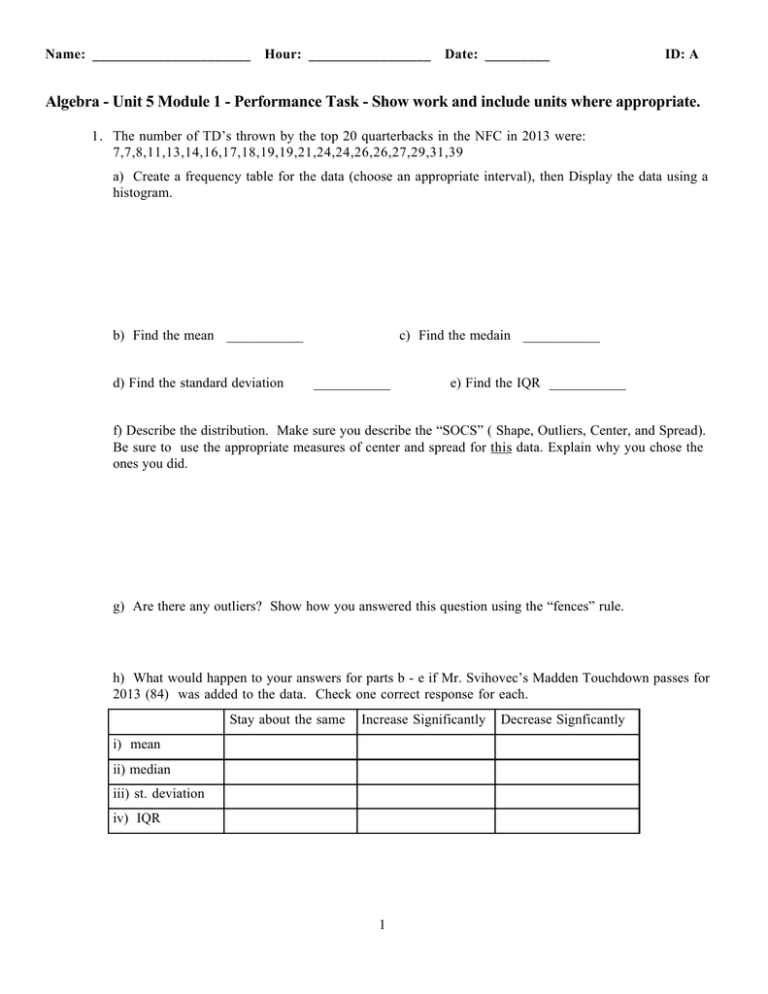
Name: ______________________ Hour: _________________ Date: _________ ID: A Algebra - Unit 5 Module 1 - Performance Task - Show work and include units where appropriate. 1. The number of TD’s thrown by the top 20 quarterbacks in the NFC in 2013 were: 7,7,8,11,13,14,16,17,18,19,19,21,24,24,26,26,27,29,31,39 a) Create a frequency table for the data (choose an appropriate interval), then Display the data using a histogram. b) Find the mean ___________ d) Find the standard deviation c) Find the medain ___________ ___________ e) Find the IQR ___________ f) Describe the distribution. Make sure you describe the “SOCS” ( Shape, Outliers, Center, and Spread). Be sure to use the appropriate measures of center and spread for this data. Explain why you chose the ones you did. g) Are there any outliers? Show how you answered this question using the “fences” rule. h) What would happen to your answers for parts b - e if Mr. Svihovec’s Madden Touchdown passes for 2013 (84) was added to the data. Check one correct response for each. Stay about the same Increase Significantly i) mean ii) median iii) st. deviation iv) IQR 1 Decrease Signficantly Name: ______________________ ID: A 2. The average points per game for the NFC and AFC for each of the 16 team in each conference are shown below (2013). NFC: 18,22,18,23,25,26,27,22,24,24,21,28,25,26,26,28 AFC: 15,20,20,18,20,23,27,25,21,19,24,27,27,28,25,38 a. Draw two box-and-whisker plots on the same number line to represent the data. b. Identify any data that are outliers. Show how you made the decision using the “fences” rule. c. Describe the shape of each distribution d. Choose the measures of center and spread that best describes both data sets. Calculate those measures for both data sets, and use them to compare the data sets. Explain why the measures you chose are the best representation. d. Which conference is more equitable (that is, the pts are more alike)? Explain. Which conference typically scores more points? Explain. 2 Name: ______________________ ID: A 3. A total of 77 male and 115 females were surveyed. They were asked to describe their polictics as “Liberal”, “Moderate,” or “Conservative.” The results are shown in the table. Males Females L 35 50 M 36 44 a. What category of responses is not included in the two-way table? Add it to the table with the correct values. b. Use the completed frequency table to make a new table showing the joint and marginal relative frequencies. Round to the nearest tenth of a percent. c. Among those who don’t consider themselves Liberal, what percent of them are conservatives? d. Is there an association between gender and political preferences, according to the data? Use conditional relative frequencies in your explanation of why or why not. . 3 ID: A Algebra - Unit 5 Module 1 - Performance Task - Show work and include units where appropriate. Answer Section 1. ANS: Pieces of Candy in Jars PTS: 1 REF: f8d3efad-6ff9-11df-9c81-001185f0d2ea NAT: NT.CCSS.MTH.10.9-12.S.ID.1 LOC: 12.4.1.b KEY: data | display data | histogram | frequency MSC: DOK 1 2. ANS: . PTS: TOP: KEY: MSC: 3. ANS: . 1 DIF: Level B REF: MALG1759 STA: WI.WIFRM.MTH.05.10.E.a.2 Lesson 13.6 Use Measures of Central Tendency and Dispersion mode | appropriate | word | real-life | mean | median | range | central tendency Analysis NOT: 978-0-618-65612-7 PTS: TOP: KEY: MSC: 1 DIF: Level B REF: MALG1759 STA: WI.WIFRM.MTH.05.10.E.a.2 Lesson 13.6 Use Measures of Central Tendency and Dispersion mode | appropriate | word | real-life | mean | median | range | central tendency Analysis NOT: 978-0-618-65612-7 1
