LEP 5.2.32 β-spectroscopy
advertisement

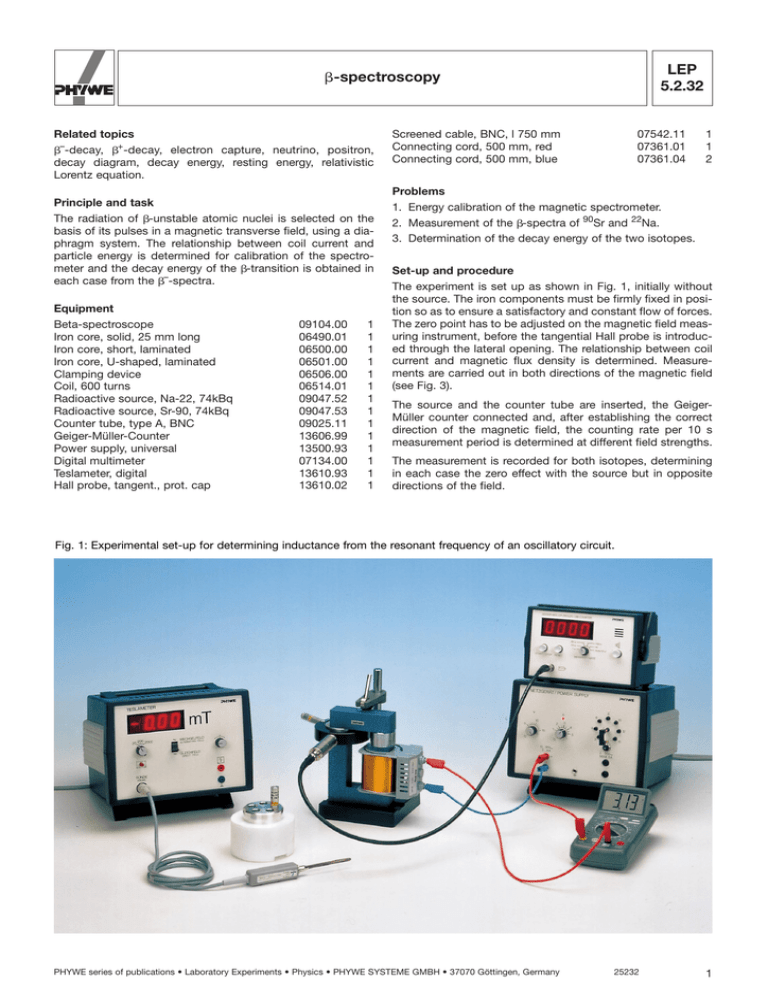
R LEP 5.2.32 b-spectroscopy Related topics b–-decay, b+-decay, electron capture, neutrino, positron, decay diagram, decay energy, resting energy, relativistic Lorentz equation. Principle and task The radiation of b-unstable atomic nuclei is selected on the basis of its pulses in a magnetic transverse field, using a diaphragm system. The relationship between coil current and particle energy is determined for calibration of the spectrometer and the decay energy of the b-transition is obtained in each case from the b–-spectra. Equipment Beta-spectroscope Iron core, solid, 25 mm long Iron core, short, laminated Iron core, U-shaped, laminated Clamping device Coil, 600 turns Radioactive source, Na-22, 74kBq Radioactive source, Sr-90, 74kBq Counter tube, type A, BNC Geiger-Müller-Counter Power supply, universal Digital multimeter Teslameter, digital Hall probe, tangent., prot. cap 09104.00 06490.01 06500.00 06501.00 06506.00 06514.01 09047.52 09047.53 09025.11 13606.99 13500.93 07134.00 13610.93 13610.02 1 1 1 1 1 1 1 1 1 1 1 1 1 1 Screened cable, BNC, l 750 mm Connecting cord, 500 mm, red Connecting cord, 500 mm, blue 07542.11 07361.01 07361.04 1 1 2 Problems 1. Energy calibration of the magnetic spectrometer. 2. Measurement of the b-spectra of 90Sr and 22Na. 3. Determination of the decay energy of the two isotopes. Set-up and procedure The experiment is set up as shown in Fig. 1, initially without the source. The iron components must be firmly fixed in position so as to ensure a satisfactory and constant flow of forces. The zero point has to be adjusted on the magnetic field measuring instrument, before the tangential Hall probe is introduced through the lateral opening. The relationship between coil current and magnetic flux density is determined. Measurements are carried out in both directions of the magnetic field (see Fig. 3). The source and the counter tube are inserted, the GeigerMüller counter connected and, after establishing the correct direction of the magnetic field, the counting rate per 10 s measurement period is determined at different field strengths. The measurement is recorded for both isotopes, determining in each case the zero effect with the source but in opposite directions of the field. Fig. 1: Experimental set-up for determining inductance from the resonant frequency of an oscillatory circuit. PHYWE series of publications • Laboratory Experiments • Physics • PHYWE SYSTEME GMBH • 37070 Göttingen, Germany 25232 1 R LEP 5.2.32 b-spectroscopy Fig. 2a: Diaphragm system and magnetically deflected b-particle; r = orbital radius. Fig. 3: Calibration of the spectrometer: relationship between coil current and selected particle energy. Theory and evaluation b-particles are selected in the b-spectroscope on the basis of their energy by obliging them to follow a fixed orbit using diaphragms in a homogeneous magnetic field (Fig. 2a and 2b). In this orbit the Lorentz force, due to the magnetic cross-field, and the centrifugal force are in equilibrium: e·v·B = in which E denotes the total energy of the particles, made up of the kinetic energy Ekin and the resting energy moc2 E = Ekin + mo · c2 . m v2 . r The kinetic energy is accordingly. This yields the following expression for the momentum: Ekin = AFFFFFFFFFFFF (e B r c)2 + mo2c4 – moc2 . p=m·v=e·B·r. The equation for relativistic particles with the momentum is then E2 = p2 + mo2 c2 , c2 With a given orbital radius of r = 50 mm, it is possible to fix a specific particle energy for each magnetic field strength and for each current strength. The process of b–-decay in the atomic nucleus results in the conversation of a neutron n into a proton p and an electron e–, – which leaves the nucleus, and into an antineutrino v which is difficult to detect. The complete decay equation then runs as follows: – n R e– + p + v . b+-decay causes the occurrence of a positron, in which case the decay equation will be: p R n + e+ + v . The decay energy Ez is released during the conversion (Figs 4 and 5). Fig. 2b: b-spectroscope: 1) non magnetisable wall; 2) specimen entrance; 3) iris; 4) entrance for tangential Hall probe; 5) counter tube holder; 6 ) iris. 2 25232 Since the neutrino carries with it a proportion of the decay energy, the magnitude of which cannot determined, a continuous energy distribution occurs in which all the energy values from 0 to Ez occur. PHYWE series of publications • Laboratory Experiments • Physics • PHYWE SYSTEME GMBH • 37070 Göttingen, Germany R LEP 5.2.32 b-spectroscopy Fig. 4: Decay diagram of 90Sr. Fig. 7: b-spectrumof 22Na. Fig. 5: Decay diagram of 22Na. Fig. 6 yields on the basis of the 90Sr energy spectrum a maximum energy of about Ez = 2500 keV and the following value for the most frequent energy: Eh = 740 ± 30 keV. Fig.7 yields on the basis of the 22Na energy spectrum a maximum energy of about Ez = 900 keV and the following value for the most frequent energy: Eh = 210 ± 30 keV. A further characteristic of the b-spectrum is its most frequent energy Eh which will always be one third of the maximum energy Ez: Eh = 1/3 Ez . The most frequent energy Eh can be determined with a very much greater accuracy than the maximum energy Ez , since at the upper end the spectrum passes with a flat slope into the zero effect. Notes 1. The direction of the magnetic field will vary in some of the experiments, since the radiation particles have a different sign. 2. More careful examination reveals that the scaling of the spectral intensities is not constant in the measured spectra for the following reasons: (a) the interval width per energy measurement is a momentum window and not an energy window. (b) the probability of response of the counter tube and the resolution of the spectrometer are energy-dependent. The spectra are as a result distorted, although this does not affect their predictive value in relation to the energies. 3. The greatly intensified background in the 22Na spectrum is attributable to the 511 keV annihilation radiation. Fig. 6: b-spectrum of 90Sr. 4. The spectra are made up of several fractions in both cases. In conjunction with the limited resolution of the spectrometer, this results in a sytsematic measurement error. The most frequent particle energy is in agreement with the theoretical values for both isotopes within the limits of measurement accuracy. PHYWE series of publications • Laboratory Experiments • Physics • PHYWE SYSTEME GMBH • 37070 Göttingen, Germany 25232 3


