Line of Best Fit
advertisement

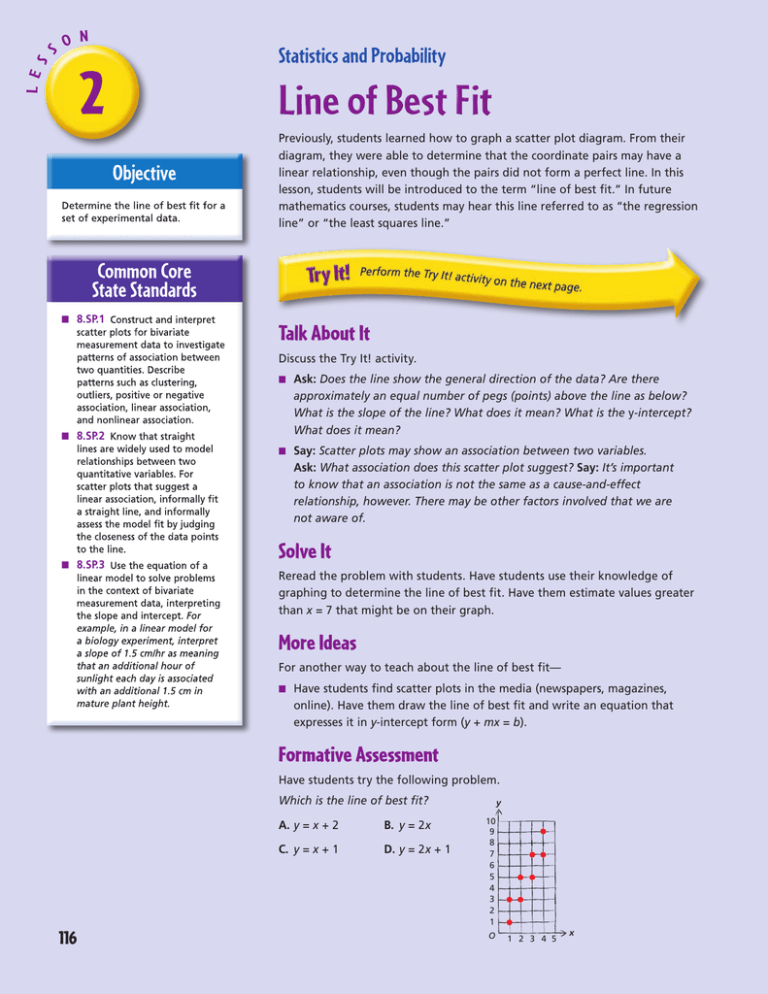
Statistics and Probability 2 Line of Best Fit Objective Previously, students learned how to graph a scatter plot diagram. From their diagram, they were able to determine that the coordinate pairs may have a linear relationship, even though the pairs did not form a perfect line. In this lesson, students will be introduced to the term “line of best fit.” In future mathematics courses, students may hear this line referred to as “the regression line” or “the least squares line.” Common Core State Standards ■■ 8.SP.1 Talk About It Discuss the Try It! activity. ■■ Ask: Does the line show the general direction of the data? Are there ■■ 8.SP.2 approximately an equal number of pegs (points) above the line as below? What is the slope of the line? What does it mean? What is the y-intercept? What does it mean? ■■ Say: Scatter plots may show an association between two variables. Ask: What association does this scatter plot suggest? Say: It’s important to know that an association is not the same as a cause-and-effect relationship, however. There may be other factors involved that we are not aware of. ■■ 8.SP.3 Solve It Reread the problem with students. Have students use their knowledge of graphing to determine the line of best fit. Have them estimate values greater than x = 7 that might be on their graph. More Ideas For another way to teach about the line of best fit— ■■ Have students find scatter plots in the media (newspapers, magazines, online). Have them draw the line of best fit and write an equation that expresses it in y-intercept form (y + mx = b). Formative Assessment Have students try the following problem. Which is the line of best fit? 116 A.y = x + 2 B. y = 2x C. y = x + 1 D.y = 2x + 1 y 10 9 8 7 6 5 4 3 2 1 O 1 2 3 4 5 x GR7-8_Graph5 Try It! 30 minutes | Pairs Here is a problem about the line of best fit. Widget Works is a shop that produces handmade custom widgets. The table shows the number of hours worked and the number of widgets produced by ten skilled craftspeople. 1 2 3 4 5 6 7 8 9 10 x-Hours Worked 2 7 1 5 2 6 3 4 6 4 y-Widgets Produced 3 7 2 7 2 8 3 5 6 6 Determine the line of best fit that relates to the number of hours worked and the number of widgets produced. Write the equation for the line in y-intercept form (y = mx + b). Introduce the problem. Then have students do the activity to solve the problem. Distribute the materials. Materials • XY Coordinate Pegboard • ruler or straightedge 1. Have students peg the coordinate pairs on their XY Coordinate Pegboard. 2. Have students determine whether or not there is a linear relationship between the coordinate values. Ask: Can you draw a straight line that will lie near all of the data points? 3. Have students take a ruler or straightedge and see if they can find a “line of best fit.” The line should “split” the pegs, leaving the same number of pegs above the line as below it (or as close to this as possible). 4. Have students use the slope and the y-intercept to write the equation for this line of best fit. (The y-intercept should be estimated to the nearest whole number.) Statistics and Probability Craftsperson 117 Lesson 2 Name Statistics and Probability Answer Key Use an XY Coordinate Pegboard to model the scatter plot shown. Write the equation for the line of best fit in the form y = mx + b. (Check students’ work.) 1. If the line extended to the y-axis, where would it intersect?_______________________ 0 1 What is the slope of the line?_____________ The equation for the line of best fit is y=x ________________________________________ . Using an XY Coordinate Pegboard, model the scatter plot shown. Write the equation for the line of best fit in the form y = mx + b. (Check students’ models.) 2. 2 For the line of best fit, b = _________ . 1 For the line of best fit, m = _________ . The equation for the line of best fit is y=x+2 __________________________________ . Write the equation for the line of best fit for each scatter plot. 3. 4. 10 9 8 7 6 5 4 3 2 1 0 1 2 3 4 5 6 7 8 9 10 118 Hands-On Standards, Common Core Edition 0 0 1 2 3 4 5 6 7 8 9 10 y = –2x + 9 ____________________ 10 9 8 7 6 5 4 3 2 1 1 2 3 4 5 6 7 8 9 10 y=x+4 ____________________ Download student pages at hand2mind.com/hosstudent. © ETA hand2mind™ y=x+1 ____________________ 5. 10 9 8 7 6 5 4 3 2 1 Name Key Answer Challenge! How can you tell from looking at the points in a scatter plot if the line of best fit has a positive or negative slope? Draw a picture to help. Challenge: (Sample) If the points tend to move higher up the grid as they go from left to right, then the line of best fit has a positive slope. If the points tend to move lower down the grid as they go from left to right, then the line of best fit has a negative slope. © ETA hand2mind™ Download student pages at hand2mind.com/hosstudent. Hands-On Standards, Common Core Edition 119 Lesson 2 Name Statistics and Probability Use an XY Coordinate Pegboard to model the scatter plot shown. Write the equation for the line of best fit in the form y = mx + b. 1. If the line extended to the y-axis, where would it intersect?_______________________ What is the slope of the line?_____________ The equation for the line of best fit is ________________________________________ . Using an XY Coordinate Pegboard, model the scatter plot shown. Write the equation for the line of best fit in the form y = mx + b. 2. For the line of best fit, b = _________ . For the line of best fit, m = _________ . The equation for the line of best fit is __________________________________ . Write the equation for the line of best fit for each scatter plot. 3. 4. 10 9 8 7 6 5 4 3 2 1 0 1 2 3 4 5 6 7 8 9 10 118 Hands-On Standards, Common Core Edition 0 1 2 3 4 5 6 7 8 9 10 ____________________ 10 9 8 7 6 5 4 3 2 1 0 1 2 3 4 5 6 7 8 9 10 ____________________ www.hand2mind.com © ETA hand2mind™ ____________________ 5. 10 9 8 7 6 5 4 3 2 1 Name Challenge! How can you tell from looking at the points in a scatter plot if the line of best fit has a positive or negative slope? Draw a picture to help. © ETA hand2mind™ www.hand2mind.com Hands-On Standards, Common Core Edition 119


