It is exciting that in an introductory circuits textbook you get to begin

7.1(1)
M
ULTISIM
D
EMO
7.1: M
EASURING
I
MPEDANCE WITH THE
N
ETWORK
A
NALYZER
It is exciting that in an introductory circuits textbook you get to begin using a network analyzer
(if only in a simulation). These are extremely expensive and complicated pieces of equipment, often running up to a quarter-million dollars in real-life. It is somewhat difficult to get the hang of the Network Analyzer in Multisim so we will need to devote a Demo to it so we can get used to working with it.
First, to begin, let’s find the Network Analyzer. It is located under
Simulate>Instruments>Network Analyzer or you can simply click on the symbol on the instrument toolbar.
We are going to use the Network Analyzer to measure the impedance of a series RLC circuit at 1
MHz.
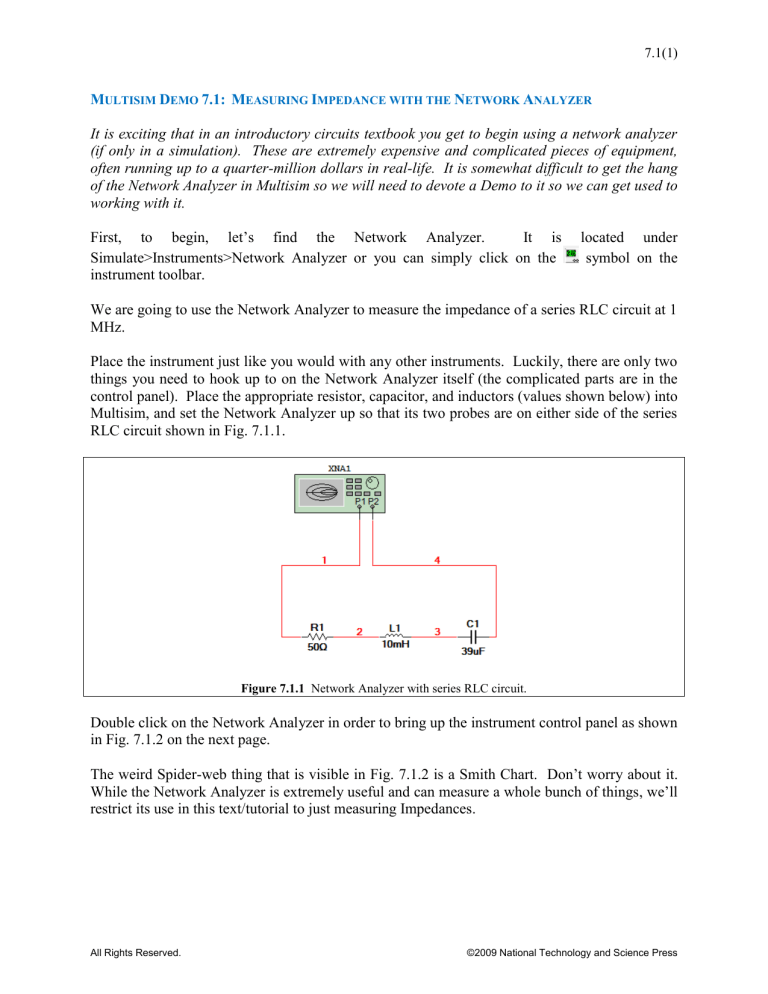
Place the instrument just like you would with any other instruments. Luckily, there are only two things you need to hook up to on the Network Analyzer itself (the complicated parts are in the control panel). Place the appropriate resistor, capacitor, and inductors (values shown below) into
Multisim, and set the Network Analyzer up so that its two probes are on either side of the series
RLC circuit shown in Fig. 7.1.1.
Figure 7.1.1
Network Analyzer with series RLC circuit.
Double click on the Network Analyzer in order to bring up the instrument control panel as shown in Fig. 7.1.2 on the next page.
The weird Spider-web thing that is visible in Fig. 7.1.2 is a Smith Chart. Don’t worry about it.
While the Network Analyzer is extremely useful and can measure a whole bunch of things, we’ll restrict its use in this text/tutorial to just measuring Impedances.
All Rights Reserved.
©2009 National Technology and Science Press
7.1(2)
Figure 7.1.2
Network Analyzer Screen
So as we know, impedance varies with frequency. So to say we want to measure the impedance of something is an incomplete statement. We need to know at what frequency or over a certain frequency range. So on the Network Analyzer:
1.
Set the Mode to Measurement.
2.
Click on the Simulation Set button found under Settings at the bottom of the window.
3.
Adjust the frequencies which you want to sweep over and other parameters (shown in
Fig. 7.1.3).
4.
Press OK.
All Rights Reserved.
Figure 7.1.3
Selecting the frequency over which to measure impedance.
©2009 National Technology and Science Press
7.1(3)
Now we are ready to simulate. Begin the Interactive Simulation. The screen of the Network
Analyzer will default back to the Smith Chart screen. Do the following:
1.
Set Mode to RF Characterizer.
2.
Under Graph select Impedance in the Param. Pull-down menu and click on the “Re/Im” button.
3.
Under Trace, select Zout or Zin or both…it doesn’t matter since they are the same in the case of our circuit.
4.
Under Functions, set the Marker pull-down menu to Re/Im
5.
Click Auto Scale.
At the bottom of the window there is a Cursor Bar depicted in Fig. 7.1.4. Clicking on the right arrow (above “10 MHz”) will move a little green triangular cursor to the right (towards higher frequencies). The left arrow button will move the cursor in the opposite direction. Use the buttons to get the cursor as close to 1 MHz as possible. (Note that you cannot click directly on the cursor and drag it with your mouse as you can with certain other instruments and simulations.)
Figure 7.1.4
Network Analyzer Cursor Bar.
Once the cursor is in position, the screen should now look like that shown in Fig. 7.1.4 below.
Figure 7.1.4
Network Analyzer screen
As we can see, the impedance is 100.008 + j62.83×10
3
Ω. This value is actually not the impedance, however. This is because the load impedance of the system is set to 50 Ω. This should ideally be compensated for with the network analyzer, but it seems that it isn’t. As a
All Rights Reserved.
©2009 National Technology and Science Press
7.1(4) result, in order to get the proper value, take the measured value, Zin (or Zout), and subtract the
50 Ω real impedance. This will yield a value of 50.008 + j62.83×10 3
Ω.
What should the impedance be based on theory?
Z R j L j
50 j 2 10
6
10 10
3 j
C 2 10
6
39 10
6
This value is almost identical to what we get using the Network Analyzer!
50 j 62 .
83 10
3 Ω
All Rights Reserved.
©2009 National Technology and Science Press


