Specific Heat Capacity Measurements Using DSC I
advertisement
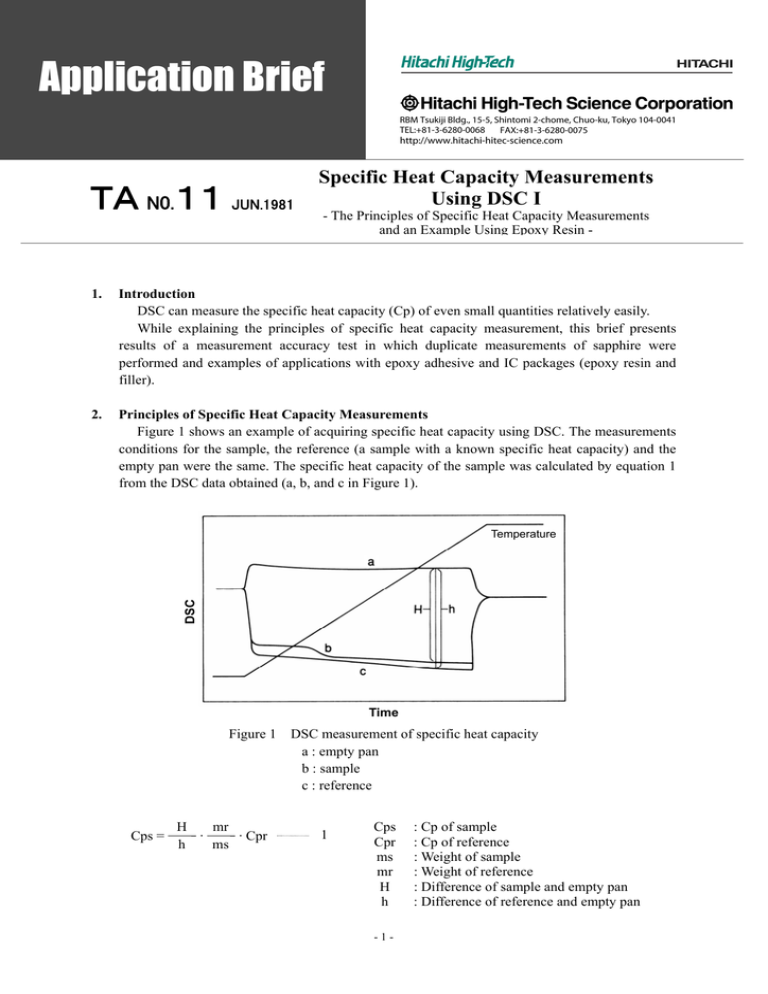
TA N0.11 JUN.1981 Specific Heat Capacity Measurements Using DSC I - The Principles of Specific Heat Capacity Measurements and an Example Using Epoxy Resin - 1. Introduction DSC can measure the specific heat capacity (Cp) of even small quantities relatively easily. While explaining the principles of specific heat capacity measurement, this brief presents results of a measurement accuracy test in which duplicate measurements of sapphire were performed and examples of applications with epoxy adhesive and IC packages (epoxy resin and filler). 2. Principles of Specific Heat Capacity Measurements Figure 1 shows an example of acquiring specific heat capacity using DSC. The measurements conditions for the sample, the reference (a sample with a known specific heat capacity) and the empty pan were the same. The specific heat capacity of the sample was calculated by equation 1 from the DSC data obtained (a, b, and c in Figure 1). DSC Temperature Time Figure 1 Cps = H mr · · Cpr h ms DSC measurement of specific heat capacity a : empty pan b : sample c : reference 1 Cps Cpr ms mr H h -1- : Cp of sample : Cp of reference : Weight of sample : Weight of reference : Difference of sample and empty pan : Difference of reference and empty pan 3. Results 3-1 Accuracy of the Specific Heat Capacity Measurements Figure 2 shows the results for four repeated measurements of a 30mg sapphire sample. The vertical axis is the difference of the measured and literature values. The variation of the repeated measurement was within about 2%. Table 1 shows the average values (avg), standard deviations (SD), literature values and deviations from the literature values. Comparisons with literature values show that the accuracy of the average of the four specific heat capacity measurements was within 1%. It is assumed that it is best to perform DSC measurements of specific heat capacity with samples and reference that have roughly same the heat capacity. To confirm this, measurements were performed with the heat capacity of sapphire at 65%, 99% and 175% of the heat capacity of the reference. The results in Table 2 confirm that the measurement accuracy was highest for the 29.68mg sample, the condition where the heat capacity of the sample and the reference were roughly equal. Figure 2 Results for repeated measurements of sapphire ΔCp = Cp (literature value) - Cp (measured value) Sample weight : 29.7mg Heating rate : 10℃/min Table 1 Repeated measurements (n=4) of the specific heat capacity of sapphire Literature value Deviation (%) from Temp.(°C) avg. (J/g・deg) SD C.V. (%) literature value (J/g・deg) 40 0.806 0.018 2.2 0.806 0.0 60 0.844 0.012 1.4 0.843 -0.1 80 0.874 0.008 0.9 0.877 -0.3 100 0.912 0.006 0.7 0.908 -0.4 120 0.941 0.005 0.5 0.935 -0.6 140 0.965 0.004 0.4 0.959 -0.6 160 0.989 0.006 0.6 0.981 -0.8 180 1.007 0.007 0.7 1.001 -0.6 -2- Table 2 Specific heat capacity measurement results for different sapphire weights 19.20mg 29.68mg 50.25mg Temp. Deviation Deviation measured measured measured Deviation (%) (°C) (%) from (%) from from (J/g・deg) (J/g・deg) (J/g・deg) literature literature literature 40 0.800 -0.7 0.795 -1.4 0.797 -1.1 60 0.851 0.9 0.843 0.0 0.835 -0.9 80 0.888 1.3 0.877 0.0 0.862 -1.7 100 0.929 2.3 0.912 0.4 0.901 -0.8 120 0.966 3.3 0.942 0.7 0.928 -0.7 140 0.989 3.1 0.966 0.7 0.949 -1.0 160 1.017 3.7 0.989 0.8 0.968 -1.2 Reference weight : 29.71 mg 3-2 Measuring the specific heat capacity of epoxy adhesives Both Figure 3 and Table 3 show the specific heat capacity measurement results for an epoxy adhesive. Figure 3 plots the specific heat capacity versus the temperature and shows the change process of specific heat capacity. The large increase of specific heat capacity between 70°C and 90°C is due to the glass transition of the epoxy. Table 3 lists the specific heat capacity values by temperature. 3-3 Measuring the specific heat capacity of IC packages Both Figure 4 and Table 3 show the specific heat capacity measurement results for the IC package, which is filled with epoxy resin (approximately 20%) and other inorganic material. The specific heat capacity of the IC package was likely lower than the epoxy adhesive because specific heat capacity of inorganic material is lower than the resin. Figure 3 Specific heat capacity results for epoxy adhesive Temperature interval for Cp calculation : 5 °C -3- Figure 4 Specific heat capacity results for IC package Temperature interval for Cp calculation : 5 °C Table 3 Cp for epoxy adhesive and IC package Cp (J/g・deg) Temp. (°C) Epoxy adhesive IC package 30 1.188 0.910 35 1.210 0.923 40 1.228 0.941 45 1.231 0.968 50 1.245 1.000 55 1.254 1.029 60 1.274 1.058 65 1.282 1.090 70 1.310 1.111 75 1.340 1.112 80 1.408 1.105 85 1.499 1.116 90 1.575 1.112 95 1.609 1.111 100 1.614 1.109 105 1.615 1.102 110 1.621 1.110 115 1.628 1.107 120 1.642 1.118 125 1.633 1.122 130 1.650 1.130 135 1.651 1.155 140 1.645 1.160 145 1.647 1.167 150 1.660 1.181 155 1.665 1.178 160 1.652 1.188 165 1.675 1.207 170 1.660 1.220 175 1.651 1.221 -4-
