Simulation Results From figure 1 we can see that as the
advertisement
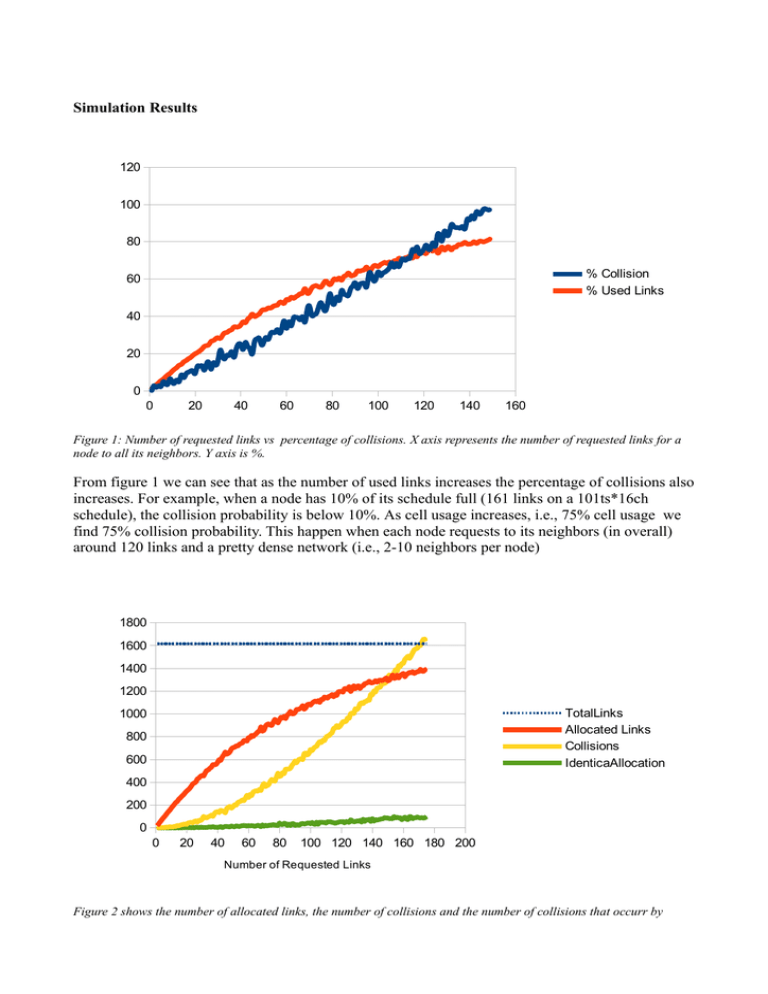
Simulation Results 120 100 80 % Collision % Used Links 60 40 20 0 0 20 40 60 80 100 120 140 160 Figure 1: Number of requested links vs percentage of collisions. X axis represents the number of requested links for a node to all its neighbors. Y axis is %. From figure 1 we can see that as the number of used links increases the percentage of collisions also increases. For example, when a node has 10% of its schedule full (161 links on a 101ts*16ch schedule), the collision probability is below 10%. As cell usage increases, i.e., 75% cell usage we find 75% collision probability. This happen when each node requests to its neighbors (in overall) around 120 links and a pretty dense network (i.e., 2-10 neighbors per node) 1800 1600 1400 1200 TotalLinks Allocated Links Collisions IdenticaAllocation 1000 800 600 400 200 0 0 20 40 60 80 100 120 140 160 180 200 Number of Requested Links Figure 2 shows the number of allocated links, the number of collisions and the number of collisions that occurr by allocating the same link (it is a particular case as it is a collision but does not introduce a problem to the schedule), according to the number of links requested by a particular node to its neighbors. As it can be seen in Figure 2, as the number of requests per node increases the number of allocated links on the schedule also increase. The behavior is asymptotic with respect to the number of available links in the schedule as the number of collisions increase slowing down the convergence to the full schedule. Figure 2 does not show when the schedule gets completely allocated (as the plot cannot be seen correctly). From the simulation results this happens when each node requests around 550 links in total to its neighbors. Then the number of collisions is extremely high >3000.
