USE ALL. COMPUTE filter_$=(participant ~= 6 & participant ~= 12).
advertisement
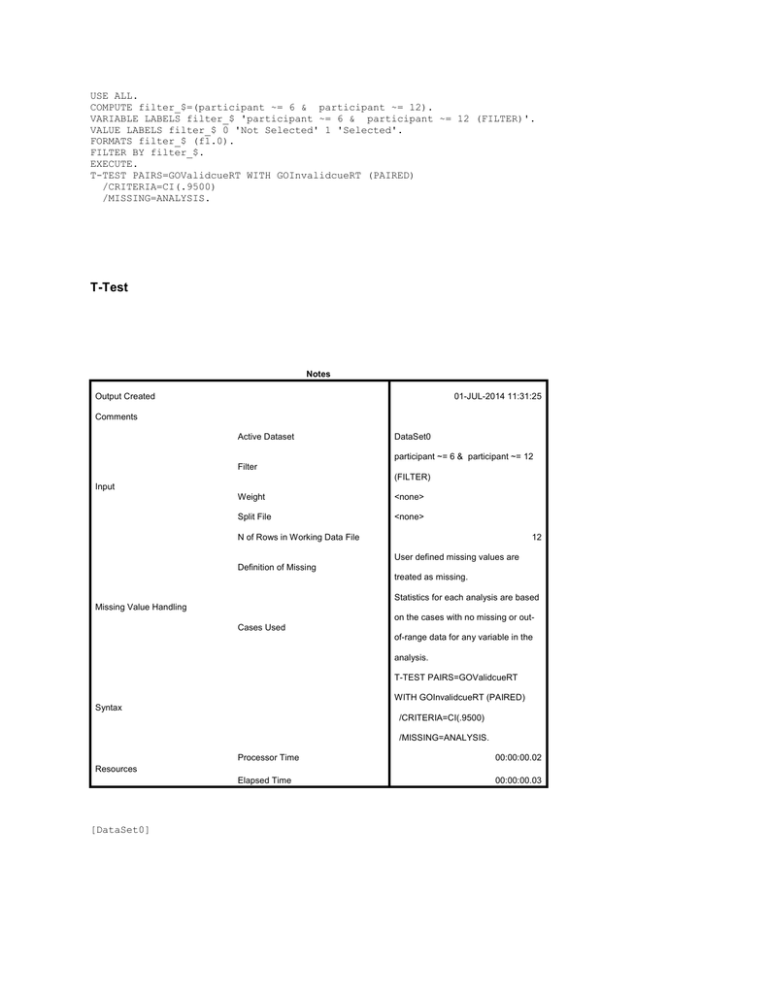
USE ALL. COMPUTE filter_$=(participant ~= 6 & participant ~= 12). VARIABLE LABELS filter_$ 'participant ~= 6 & participant ~= 12 (FILTER)'. VALUE LABELS filter_$ 0 'Not Selected' 1 'Selected'. FORMATS filter_$ (f1.0). FILTER BY filter_$. EXECUTE. T-TEST PAIRS=GOValidcueRT WITH GOInvalidcueRT (PAIRED) /CRITERIA=CI(.9500) /MISSING=ANALYSIS. T-Test Notes Output Created 01-JUL-2014 11:31:25 Comments Active Dataset DataSet0 participant ~= 6 & participant ~= 12 Filter (FILTER) Input Weight <none> Split File <none> N of Rows in Working Data File 12 User defined missing values are Definition of Missing treated as missing. Statistics for each analysis are based Missing Value Handling on the cases with no missing or outCases Used of-range data for any variable in the analysis. T-TEST PAIRS=GOValidcueRT WITH GOInvalidcueRT (PAIRED) Syntax /CRITERIA=CI(.9500) /MISSING=ANALYSIS. Processor Time 00:00:00.02 Elapsed Time 00:00:00.03 Resources [DataSet0] Paired Samples Statistics Mean N Std. Deviation Std. Error Mean GOValidcueRT 312.3808 12 36.89759 10.65142 GOInvalidcueRT 327.2258 12 45.81397 13.22535 Pair 1 Paired Samples Correlations N Pair 1 Correlation GOValidcueRT & GOInvalidcueRT 12 Sig. .911 .000 Paired Samples Test Paired Differences Mean Std. Deviation Std. Error Mean 95% Confidence Interval of the Difference Lower Pair 1 GOValidcueRT - GOInvalidcueRT -14.84500 19.47223 5.62115 -27.21707 Paired Samples Test Paired Differences t df Sig. (2-tailed) 95% Confidence Interval of the Difference Upper Pair 1 GOValidcueRT - GOInvalidcueRT -2.47293 -2.641 11 .023 GLM GOvalidcueACC GOinvalidcueACC NOGOvalidcueACC NOGOinvalidcueACC /WSFACTOR=GONOGO 2 Polynomial ValidInvalidCUE 2 Polynomial /METHOD=SSTYPE(3) /PLOT=PROFILE(ValidInvalidCUE*GONOGO) /EMMEANS=TABLES(OVERALL) /EMMEANS=TABLES(GONOGO) /EMMEANS=TABLES(ValidInvalidCUE) /EMMEANS=TABLES(GONOGO*ValidInvalidCUE) /PRINT=DESCRIPTIVE /CRITERIA=ALPHA(.05) /WSDESIGN=GONOGO ValidInvalidCUE GONOGO*ValidInvalidCUE. This RT comparison (Go trials) would appear as: t(11) = -2.64, p = .023 General Linear Model [DataSet0] Within-Subjects Factors Measure: MEASURE_1 GONOGO ValidInvalidCUE Dependent Variable 1 GOvalidcueACC 2 GOinvalidcueACC 1 NOGOvalidcueACC 2 NOGOinvalidcueACC 1 2 Descriptive Statistics Mean Std. Deviation N GOvalidcueACC .9958 .01165 12 GOinvalidcueACC .9958 .01443 12 NOGOvalidcueACC .9833 .02060 12 NOGOinvalidcueACC .9583 .05967 12 Tests the null hypothesis that the error covariance matrix of the orthonormalized transformed dependent variables is proportional to an identity matrix.a a. Design: Intercept Within Subjects Design: GONOGO + ValidInvalidCUE + GONOGO * ValidInvalidCUE b. May be used to adjust the degrees of freedom for the averaged tests of significance. Corrected tests are displayed in the Tests of Within-Subjects Effects table. GoNogo: F(1,11) = 5.85, p = .034 Tests of Within-Subjects Effects Measure: MEASURE_1 Source Type III Sum of df Mean Square F Squares Sphericity Assumed .007 1 .007 5.851 Greenhouse-Geisser .007 1.000 .007 5.851 Huynh-Feldt .007 1.000 .007 5.851 Lower-bound .007 1.000 .007 5.851 Sphericity Assumed .014 11 .001 Greenhouse-Geisser .014 11.000 .001 Huynh-Feldt .014 11.000 .001 Lower-bound .014 11.000 .001 Sphericity Assumed .002 1 .002 2.260 Greenhouse-Geisser .002 1.000 .002 2.260 Huynh-Feldt .002 1.000 .002 2.260 Lower-bound .002 1.000 .002 2.260 Sphericity Assumed .009 11 .001 Greenhouse-Geisser .009 11.000 .001 Huynh-Feldt .009 11.000 .001 Lower-bound .009 11.000 .001 Sphericity Assumed .002 1 .002 2.121 Greenhouse-Geisser .002 1.000 .002 2.121 Huynh-Feldt .002 1.000 .002 2.121 Lower-bound .002 1.000 .002 2.121 Sphericity Assumed .010 11 .001 Greenhouse-Geisser .010 11.000 .001 Huynh-Feldt .010 11.000 .001 Lower-bound .010 11.000 .001 GONOGO Error(GONOGO) ValidInvalidCUE Error(ValidInvalidCUE) GONOGO * ValidInvalidCUE Error(GONOGO*ValidInvalidCUE) Tests of Within-Subjects Effects Measure: MEASURE_1 Source Sig. Sphericity Assumed .034 Greenhouse-Geisser .034 Huynh-Feldt .034 Lower-bound .034 GONOGO Sphericity Assumed Greenhouse-Geisser Error(GONOGO) Huynh-Feldt Lower-bound Sphericity Assumed .161 Greenhouse-Geisser .161 Huynh-Feldt .161 Lower-bound .161 ValidInvalidCUE Sphericity Assumed Greenhouse-Geisser Error(ValidInvalidCUE) Huynh-Feldt Lower-bound Sphericity Assumed .173 Greenhouse-Geisser .173 Huynh-Feldt .173 Lower-bound .173 GONOGO * ValidInvalidCUE Sphericity Assumed Greenhouse-Geisser Error(GONOGO*ValidInvalidCUE) Huynh-Feldt Lower-bound Tests of Within-Subjects Contrasts Measure: MEASURE_1 Source GONOGO ValidInvalidCUE Type III Sum of df Mean Square Squares GONOGO Linear .007 1 .007 Error(GONOGO) Linear .014 11 .001 ValidInvalidCUE Linear .002 1 .002 Error(ValidInvalidCUE) Linear .009 11 .001 GONOGO * ValidInvalidCUE Linear Linear .002 1 .002 Error(GONOGO*ValidInvalidCUE) Linear Linear .010 11 .001 Tests of Within-Subjects Contrasts Measure: MEASURE_1 Source GONOGO GONOGO Linear Error(GONOGO) Linear ValidInvalidCUE ValidInvalidCUE Linear F Sig. 5.851 .034 2.260 .161 Error(ValidInvalidCUE) Linear GONOGO * ValidInvalidCUE Linear Linear Error(GONOGO*ValidInvalidCUE) Linear Linear 2.121 Tests of Between-Subjects Effects Measure: MEASURE_1 Transformed Variable: Average Source Type III Sum of df Mean Square F Sig. Squares Intercept 46.413 1 46.413 .015 11 .001 Error 34810.000 .000 Estimated Marginal Means 1. Grand Mean Measure: MEASURE_1 Mean Std. Error 95% Confidence Interval Lower Bound .983 .005 Upper Bound .972 .995 2. GONOGO Measure: MEASURE_1 GONOGO Mean Std. Error 95% Confidence Interval Lower Bound Upper Bound 1 .996 .003 .990 1.001 2 .971 .010 .949 .993 3. ValidInvalidCUE Measure: MEASURE_1 ValidInvalidCUE Mean Std. Error 95% Confidence Interval Lower Bound Upper Bound 1 .990 .003 .983 .997 2 .977 .009 .957 .997 .173 4. GONOGO * ValidInvalidCUE Measure: MEASURE_1 GONOGO ValidInvalidCUE Mean Std. Error 95% Confidence Interval Lower Bound Upper Bound 1 .996 .003 .988 1.003 2 .996 .004 .987 1.005 1 .983 .006 .970 .996 2 .958 .017 .920 .996 1 2 Profile Plots Go/No-Go: F(1,11) = 5.85, p = .034 Validity: F(1,11) = 2.26, p = .16 (ns) Go/No-Go by Cue Validity: F(1,11) = 2.12, p = .17 (ns) T-TEST PAIRS=NOGOvalidcueACC WITH NOGOinvalidcueACC (PAIRED) /CRITERIA=CI(.9500) /MISSING=ANALYSIS. T-Test Paired Samples Statistics Mean N Std. Deviation Std. Error Mean NOGOvalidcueACC .9833 12 .02060 .00595 NOGOinvalidcueACC .9583 12 .05967 .01723 Pair 1 Paired Samples Correlations N Correlation Sig. NOGOvalidcueACC & Pair 1 12 .382 .220 NOGOinvalidcueACC Paired Samples Test Paired Differences Mean Std. Deviation Std. Error Mean 95% Confidence Interval of the Difference Lower NOGOvalidcueACC Pair 1 .02500 .05519 .01593 -.01006 NOGOinvalidcueACC Paired Samples Test Paired Differences t df Sig. (2-tailed) 95% Confidence Interval of the Difference Upper NOGOvalidcueACC Pair 1 .06006 1.569 11 NOGOinvalidcueACC Reads: t(11) = 1.57, p = .145 (ns) The validity of the cue did not differentially influence accuracy for No-Go trials. .145
