GRADUATE COURSE PROPOSAL OR REVISION, Cover Sheet
advertisement
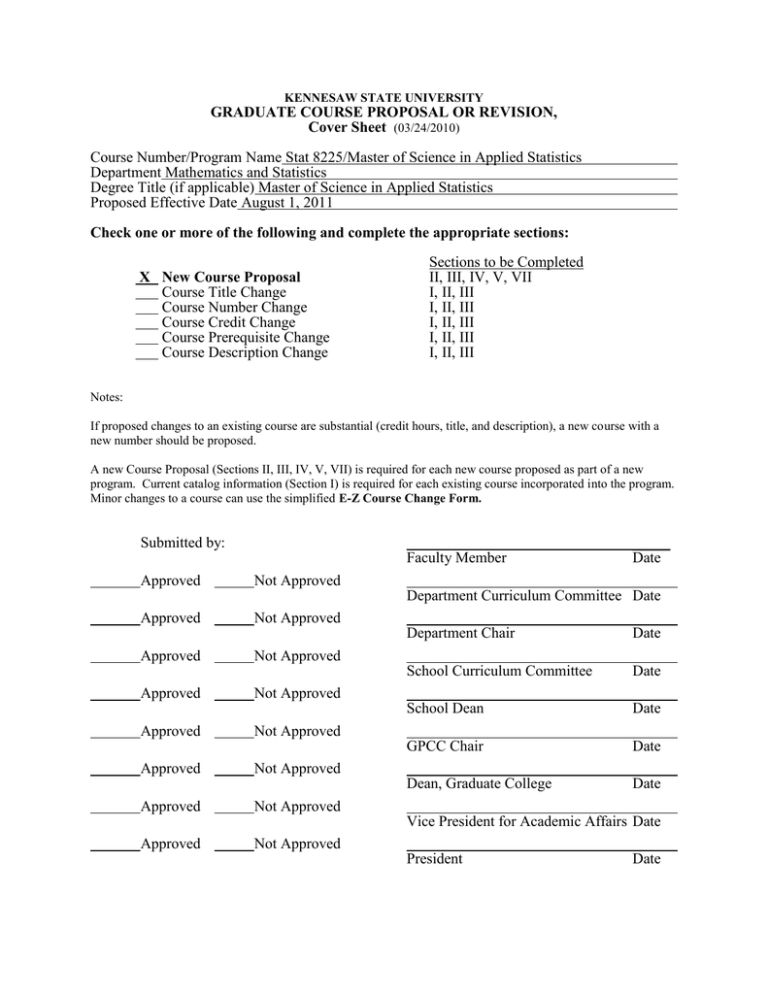
KENNESAW STATE UNIVERSITY GRADUATE COURSE PROPOSAL OR REVISION, Cover Sheet (03/24/2010) Course Number/Program Name Stat 8225/Master of Science in Applied Statistics Department Mathematics and Statistics Degree Title (if applicable) Master of Science in Applied Statistics Proposed Effective Date August 1, 2011 Check one or more of the following and complete the appropriate sections: X New Course Proposal Course Title Change Course Number Change Course Credit Change Course Prerequisite Change Course Description Change Sections to be Completed II, III, IV, V, VII I, II, III I, II, III I, II, III I, II, III I, II, III Notes: If proposed changes to an existing course are substantial (credit hours, title, and description), a new course with a new number should be proposed. A new Course Proposal (Sections II, III, IV, V, VII) is required for each new course proposed as part of a new program. Current catalog information (Section I) is required for each existing course incorporated into the program. Minor changes to a course can use the simplified E-Z Course Change Form. Submitted by: Faculty Member Approved _____ Date Not Approved Department Curriculum Committee Date Approved Approved Approved Approved Approved Approved Not Approved Department Chair Date School Curriculum Committee Date School Dean Date GPCC Chair Date Dean, Graduate College Date Not Approved Not Approved Not Approved Not Approved Not Approved Vice President for Academic Affairs Date Approved Not Approved President Date KENNESAW STATE UNIVERSITY GRADUATE COURSE/CONCENTRATION/PROGRAM CHANGE I. Current Information (Fill in for changes) Page Number in Current Catalog Course Prefix and Number Course Title Credit Hours Prerequisites Description (or Current Degree Requirements) II. Proposed Information (Fill in for changes and new courses) Course Prefix and Number __Stat 8225____________________ Course Title _Applied Longitudinal Data Analysis____________ Credit Hours 3 Prerequisites Stat 8210: Applied Regression Analysis Description (or Proposed Degree Requirements) This course introduces students to methods of longitudinal data analysis and issues involved with the analysis of repeated measures data. The course will be based on multilevel models (also referred to as hierarchical models, mixed effects models, and random coefficient models) with a major emphasis on modeling intraindividual effects as a precursor to modeling interindividual effects. Students will learn how to choose an appropriate model so that specific research questions of interest can be addressed in a methodologically sound way. III. Justification: In STAT 7100: Statistical Methods, the focus is predominantly on univariate analysis; students are taught to analyze the data one variable at a time using the tools of descriptive and inferential statistics. In STAT 8210: Applied Linear Regression Analysis and in succeeding courses, students learn to analyze the aggregate effect of several independent variables on a continuous or dichotomous response. Such a multivariable regression approach gives students the flexibility to investigate, for example, confounding and interaction effects. Unfortunately, all these courses primarily deal only with cross-sectional data. Increasingly, contemporary research involves longitudinal data; often the more interesting scientific questions are concerned with how rapidly things grow or develop over time. For instance, the cross-sectional research of Brown, et al. (1998) found that gestational age moderated the effects of cocaine exposure among newly born children. A more interesting question to ask is whether the effect of cocaine use was sustained for a certain period of time. This question was addressed in Espy, Francis, and Riese (2000): not only did they observe that cocaine-exposed infants have slower rates of growth, they also found that the effect of exposure was greater the later the infant was delivered. A major focus of this proposed course is on growth models, as exemplified in the work of Espy, Francis and Riese. In short, the new course, STAT 8225: Applied Longitudinal Data Analysis, hopes to reveal research opportunities unavailable in the world of cross-sectional data. Answering questions that involve time and change requires the application of statistically innovative methods for analyzing longitudinal data. During the past two decades, there have been major improvements in these methods. The goal of STAT 8225 is to introduce individual growth modeling to students who have been introduced to linear and logistic regression analysis. The emphasis is not on the theoretical development of the methods but on the appropriate application of the methods and correct interpretation of the results. IV. Additional Information (for New Courses only) Instructor: Dr. José N. G. Binongo Text: Judith D. Singer & John B. Willett, University Press, 2003. Applied Longitudinal Data Analysis, Oxford Prerequisites: Stat 8210 – Applied Regression Analysis Objectives: Upon successful completion of the course students should be able to: 1: a. b. c. d. e. Fit multilevel models for change to data Compare models using deviance statistics Use Wald statistics to test composite hypotheses about fixed effects Evaluate the tenability of a model's assumptions Use empirical Bayes estimates of the individual growth parameters a. b. c. d. Fit models with variably spaced measurement occasions Fit models with varying numbers of measurement occasions Incorporate time-varying (as opposed to time-invariant) predictors Recenter the effects of time 2: 3. a. Model discontinuous individual change b. Use transformations to model nonlinear individual change c. Represent individual change using a polynomial function of time d. Analyze truly nonlinear trajectories 4. Model the covariance structure Instructional Method Class time will be divided between regular lecture with explanation of theory and methodology and discussion of readings and case studies and discussion of some of the problems in the homework assignments. Method of Evaluation Written Assignments: There will be weekly quizzes, bimonthly data analysis homework, a midterm exam, final exam, and a final project. The midterm and final exams have an in-class component and a take-home component. Project: One of the objectives of this course is to give students the opportunity to acquire the skills necessary for the appropriate statistical analysis of real longitudinal data -- the kind they may use later in the workplace. The skills learned in this course are best synthesized when students get their hands on a real dataset. They will thus be asked to do an end-of-semester project. Students will analyze a longitudinal data set from beginning to end: from deciding on questions and hypotheses, to deciding on the data manipulation techniques and statistical procedures needed to do the analyses, to running the procedures, to interpreting the results, to writing the research report. Students may use their own data set (if one is available to them, if it is longitudinal, with at least three time points and if it is approved by the instructor) or one provided by the instructor. Grading: This will be calculated based on student performance and learning in the class. Homework: Quizzes: Midterm: Final Exam: Project: 15% 20% 20% 25% 20% Grade in the course will be assigned according to the following scale: 90% – 100 % 80% – 89% 70% – 79% 60% – 69% 0% – 59% V. A B C D F Resources and Funding Required (New Courses only) Resource Amount Faculty Other Personnel Equipment Supplies Travel None None None None None New Books New Journals Other (Specify) None None None TOTAL None Funding Required Beyond Normal Departmental Growth None VI. COURSE MASTER FORM This form will be completed by the requesting department and will be sent to the Office of the Registrar once the course has been approved by the Office of the President. The form is required for all new courses. DISCIPLINE COURSE NUMBER COURSE TITLE FOR LABEL (Note: Limit 16 spaces) CLASS-LAB-CREDIT HOURS Approval, Effective Term Grades Allowed (Regular or S/U) If course used to satisfy CPC, what areas? Learning Support Programs courses which are required as prerequisites Statistics Stat 8225 Applied Longitudinal Data Analysis 3-0-3 Fall 2011 Regular NA NA APPROVED: ________________________________________________ Vice President for Academic Affairs or Designee __ VII Attach Syllabus Text: Judith D. Singer & John B. Willett, Applied Longitudinal Data Analysis, Oxford University Press, 2003. Other references include: - Robert E. Weiss, Modeling Longitudinal Data, Springer, 2005. - Brady West, Kathleen B. Welch & Andrzej T. Galecki, Linear Mixed Models, Chapman & Hall/CRC, 2006. - Helen Brown & Robin Prescott, Applied Mixed Models in Medicine (2nd ed) John Wiley & Sons, 2006. - Geert Verbeke & Geert Molenberghs, Linear Mixed Models for Longitudinal Data, Springer-Verlag, 2000. - N. W. Galwey, Introduction to Mixed Modelling: Beyond Regression and Analysis of Variance, John Wiley & Sons, 2006. - Ramon C. Littell, George A. Milliken, Walter W. Stroup & Russell D. Wolfinger, SAS for Mixed Models (2nd ed), SAS Institute, 2006. Instructor: Dr. José N. G. Binongo Office: Willingham 105 Phone: 404 323 9822 E-Mail: jbinongo@kennesaw.edu Web Page: http://math.kennesaw.edu/~jbinongo Software: Students must be able to program in SAS. In this course, students will add to their repertoire of computing skills SAS procedures appropriate for the analysis of longitudinal data. Additionally, they will learn particular programming techniques for both data manipulation and data presentation not taught in the previous courses. Without a statistical package like SAS, analyzing longitudinal data is next to impossible. Written Assignments: There will be weekly quizzes, bimonthly data analysis homework, a midterm exam, final exam, and a final project. The midterm and final exams have an in-class component and a take-home component. Project: One of the objectives of this course is to give students the opportunity to acquire the skills necessary for the appropriate statistical analysis of real longitudinal data -- the kind they may use later in the workplace. The skills learned in this course are best synthesized when students get their hands on a real dataset. They will thus be asked to do an end-of-semester project. Students will analyze a longitudinal data set from beginning to end: from deciding on questions and hypotheses, to deciding on the data manipulation techniques and statistical procedures needed to do the analyses, to running the procedures, to interpreting the results, to writing the research report. Students may use their own data set (if one is available to them, if it is longitudinal, with at least three time points and if it is approved by the instructor) or one provided by the instructor. The project will be divided into the following meaningful chunks and turned in along the way as follows: 1. Phase I: Definition/approval of the data set, variables, study design, and area of study. A fairly-detailed, codebook-like description of all variables in the data set and the nature of the variables, plus a brief description of the study, its design, goals, and background. 2. Phase II: Conceptualization of change, research questions, hypotheses, and data analysis plan. A list of the main research questions, the main hypotheses, and a very specific description of how students are going to go about testing the hypotheses. 3. Phase III: Exploratory data analysis. Annotated output from students’ exploratory and preliminary analysis procedures, including data cleaning, transformations, data reduction, and recoding procedures if any. This also includes a description of how the results of the exploratory data analysis affect the data analysis strategy. 4. Phase IV: Final report. An research report of the results of the analyses, complete with a brief introduction to the topic, a brief method and procedures section, an expanded results section (in which students describe what was done, and why, and what was found), and a brief discussion section. 5. Phase V: Oral presentation. Students will give an oral presentation briefly summarizing their course project. Grading: This will be calculated based on student performance and learning in the class. Homework: Quizzes: Midterm: Final Exam: Project: 15% 20% 20% 25% 20% Grade in the course will be assigned according to the following scale: 90% – 100 % 80% – 89% 70% – 79% 60% – 69% 0% – 59% A B C D F Course Topic Outline This course is focused on continuous outcomes. It starts with a review of linear regression and analysis of variance. After this brief warm-up, we look at the type of exploratory analyses that can be used with individual growth modeling when the longitudinal data have been formatted in what has come to be known as the person-period dataset. We will then introduce and discuss simple multilevel models appropriate for representing processes within these data. Finally, we will extend the methods to more complex analytic situations that involve curvilinear and discontinuous growth trajectories and complex risk profiles, the inclusion of time-varying covariates, and the testing of complex interactions among time-invariant and time-varying predictors. 1. Introduction/Review - Binongo's handouts a. Recentering predictors b. Interpreting interactions c. Logarithmically transforming the response variable (and calculating and comparing geometric means) d. Performing two-way ANOVA e. Analysis of covariance (ANCOVA) f. Introducing random (as opposed to fixed) effects and mixed models 2. Exploratory analysis of longitudinal data - Chapters 1 & 2 a. Creating a longitudinal data set b. Analyzing descriptively individual change over time c. Exploring differences in change across subjects d. Improving the precision and reliability of ordinary least squares estimated rates of change 3. Multilevel models for change - Chapters 3 & 4 f. Fitting the multilevel model for change to data g. Comparing models using deviance statistics h. Using Wald statistics to test composite hypotheses about fixed effects i. Evaluating the tenability of a model's assumptions j. Empirical Bayes estimates of the individual growth parameters 4. How to treat time more flexibly - Chapter 5 e. Dealing with variably spaced measurement occasions f. Dealing with varying numbers of measurement occasions g. Incorporating time-varying (as opposed to time-invariant) predictors h. Recentering the effects of time 5. Discontinuous and nonlinear change - Chapter 6 a. Studying discontinuous individual change b. Using transformations to model nonlinear individual change c. Representing individual change using a polynomial function of time d. Analyzing truly nonlinear trajectories 6. Modeling the covariance structure - Chapter 7
