PHYS 1401 General Physics I One Dimensional Kinematics
advertisement

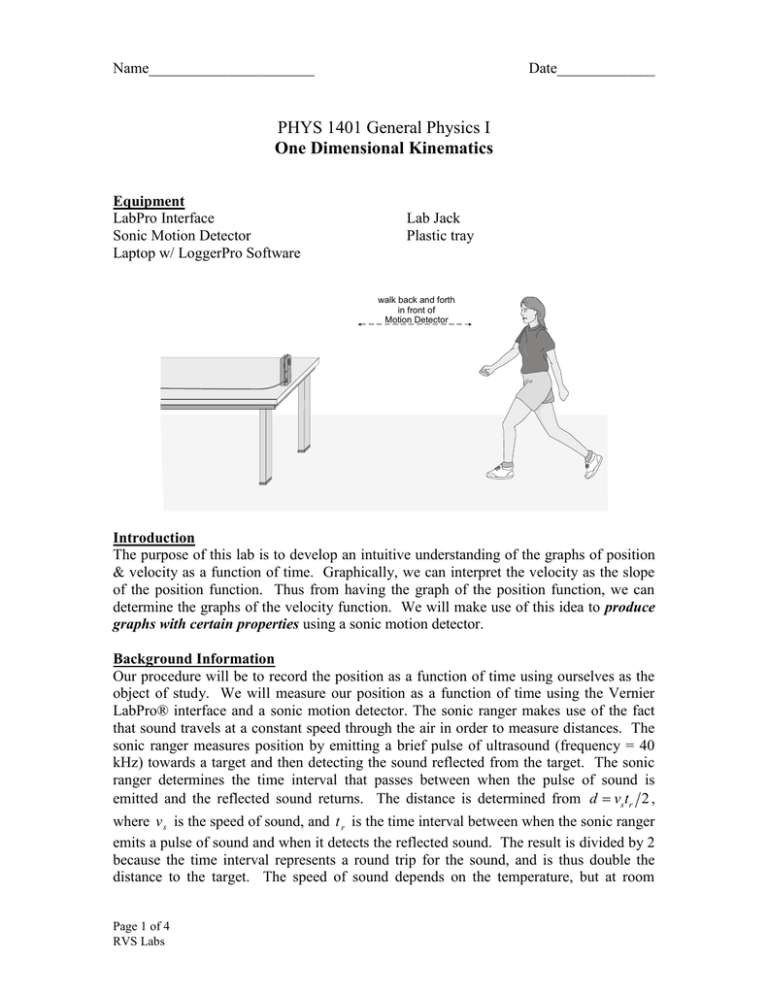
Name______________________ Date_____________ PHYS 1401 General Physics I One Dimensional Kinematics Equipment LabPro Interface Sonic Motion Detector Laptop w/ LoggerPro Software Lab Jack Plastic tray walk back and forth in front of Motion Detector Introduction The purpose of this lab is to develop an intuitive understanding of the graphs of position & velocity as a function of time. Graphically, we can interpret the velocity as the slope of the position function. Thus from having the graph of the position function, we can determine the graphs of the velocity function. We will make use of this idea to produce graphs with certain properties using a sonic motion detector. Background Information Our procedure will be to record the position as a function of time using ourselves as the object of study. We will measure our position as a function of time using the Vernier LabPro® interface and a sonic motion detector. The sonic ranger makes use of the fact that sound travels at a constant speed through the air in order to measure distances. The sonic ranger measures position by emitting a brief pulse of ultrasound (frequency = 40 kHz) towards a target and then detecting the sound reflected from the target. The sonic ranger determines the time interval that passes between when the pulse of sound is emitted and the reflected sound returns. The distance is determined from d vstr 2 , where v s is the speed of sound, and t r is the time interval between when the sonic ranger emits a pulse of sound and when it detects the reflected sound. The result is divided by 2 because the time interval represents a round trip for the sound, and is thus double the distance to the target. The speed of sound depends on the temperature, but at room Page 1 of 4 RVS Labs temperature, the speed is approximately 343 m/s, and this is the value used by the sonic ranger in determining distances. Set Up Procedure To set up the apparatus, plug the USB cable from the LabPro into the computer. (The LabPro is located in one of your table drawers). Now connect the wide telephone type plug from the sonic motion detector into the LabPro socket labeled “Dig/Sonic 1”. Place the sonic motion detector on top of the lab jack at the edge of the table in a position such that the sonic ranger has an unobstructed view of you walking towards and away over a distance of several meters. Note: the sonic ranger will not allow you to measure distances of less than 0.15m or greater than 5 m. You may hold the plastic tray in front of you as you walk to improve the quality of the reflected signal. If there is not enough room for walking, the detector may be placed on the floor facing up. Move the plastic tray up and down above the detector to produce your graphs. Data Acquisition Launch the Logger Pro program by clicking on the blue Folder in the dock at the bottom of your computer screen. Wait for this folder to load. Now click the Folder named “Graph Matching.” and then double click on the file labeled Exp 01. A blank graph labeled Distance vs. Time should appear. To test data acquisition, have someone in your group walk back and forth in front of the sonic motion detector and click on the “Collect” button located on the upper part of the graph. The apparatus will collect data for the range of time indicated on the time axis of the plot. If you have trouble getting any of this to work, notify the lab assistant or your instructor. Printing Graphs To print graphs, simply click on the printer button on the Logger Pro tool bar. Always include your names on the graphs by entering them in the printing options dialog box. Report Format This is a group project. You will turn in one report worksheet with graphs per group. Make sure that the name of each person in the group is put on the worksheet. Making Your Graphs & Worksheet Now that we’ve got our apparatus working, we will construct the following graphs. 1. Construct a graph so that the position increases linearly with time. Explain how you moved in order to achieve this result. a. Discuss among your group and then sketch in the space below what you think a graph of the velocity vs. time would look like for this picture. Sketch: b. Print the graph, and attach one copy to your group report. Page 2 of 4 RVS Labs 2. Construct a graph so that the position decreases linearly with time. Explain how you moved in order to achieve this result. a. Discuss among your group and then sketch in the space below what you think a graph of the velocity vs. time would look like for this picture. Sketch: b. Print the graph, and attach one copy to your group report. 3. Now press the “apple button” next to the spacebar on the keyboard along with the letter “Q” for quit. If asked to save changes click “NO.” You are now back to the Graph Matching folder. Click the file labeled Exp 02 and repeat the motion you used to construct your graph in Part 1 (increasing). This time both the distance versus time and velocity versus time graphs will be recorded. Discuss the accuracy of your predicted velocity versus time graph. Print the graph and attach one copy to your group report. 4. Repeat the motion you used to construct your graph in Part 2 (decreasing). Again, both the distance versus time and velocity versus time graphs will be recorded. Discuss the accuracy of your predicted velocity versus time graph. Print the graph, and attach one copy to your group report. 5. Again press the “apple button” next to the spacebar on the keyboard along with the letter “Q” for quit. If asked to save changes click “NO.” You are back to the Graph Matching folder. Click the file labeled Exp 03 to open the file. The point of this activity is to move in such a way that you reproduce the position versus time graph shown. Discuss among your group how you will have to move to reproduce the graph. Each person in the group should take a turn matching the graph. Print the best effort, and attach to the worksheet. 6. Now press the “apple button” next to the spacebar on the keyboard along with the letter “Q” for quit. If asked to save changes click “NO.” You are now back to the Graph Matching folder. Click the file labeled Exp 04 to open the file. The point of this activity is to move in such a way that you reproduce the velocity versus time graph shown. Discuss among your group how you will have to move to reproduce the graph. Each person in the group should take a turn matching the graph. Print the best effort, and attach to the worksheet. This completes the experiment. Page 3 of 4 RVS Labs Check with your instructor for any further information or procedures they may want you to follow. Page 4 of 4 RVS Labs


