KEYWORD EXPLORATION – one tweet at a time. Making sense of the world
advertisement

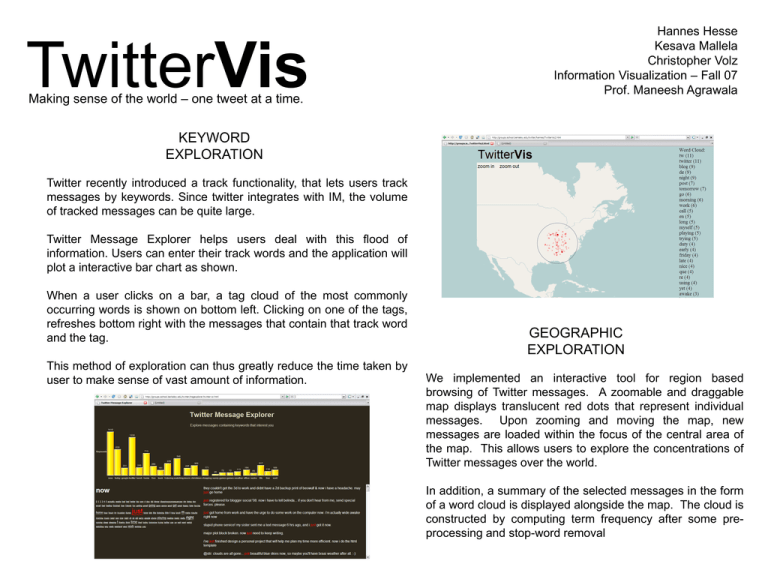
Making sense of the world – one tweet at a time. Hannes Hesse Kesava Mallela Christopher Volz Information Visualization – Fall 07 Prof. Maneesh Agrawala KEYWORD EXPLORATION Twitter recently introduced a track functionality, that lets users track messages by keywords. Since twitter integrates with IM, the volume of tracked messages can be quite large. Twitter Message Explorer helps users deal with this flood of information. Users can enter their track words and the application will plot a interactive bar chart as shown. When a user clicks on a bar, a tag cloud of the most commonly occurring words is shown on bottom left. Clicking on one of the tags, refreshes bottom right with the messages that contain that track word and the tag. This method of exploration can thus greatly reduce the time taken by user to make sense of vast amount of information. GEOGRAPHIC EXPLORATION We implemented an interactive tool for region based browsing of Twitter messages. A zoomable and draggable map displays translucent red dots that represent individual messages. Upon zooming and moving the map, new messages are loaded within the focus of the central area of the map. This allows users to explore the concentrations of Twitter messages over the world. In addition, a summary of the selected messages in the form of a word cloud is displayed alongside the map. The cloud is constructed by computing term frequency after some preprocessing and stop-word removal


