MASS SPECTROMETRY 2015 A guide for A level students
advertisement
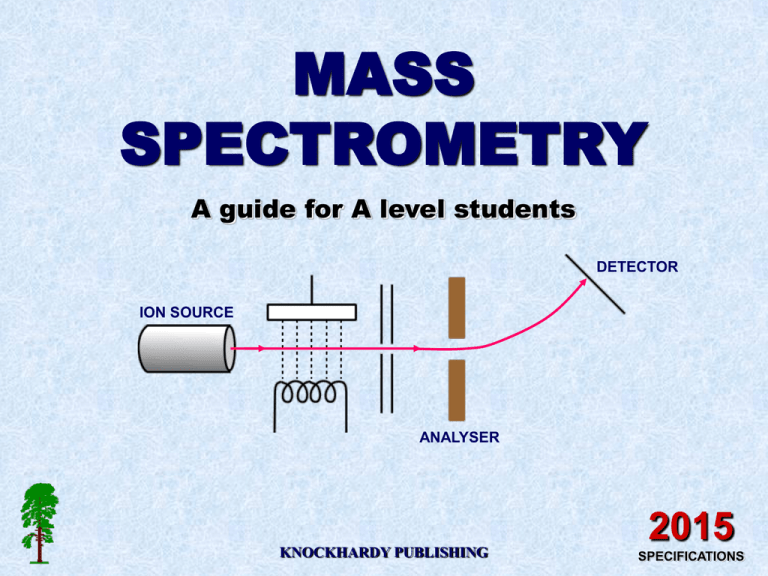
MASS SPECTROMETRY A guide for A level students DETECTOR ION SOURCE ANALYSER KNOCKHARDY PUBLISHING 2015 SPECIFICATIONS KNOCKHARDY PUBLISHING MASS SPECTROMETRY INTRODUCTION This Powerpoint show is one of several produced to help students understand selected topics at AS and A2 level Chemistry. It is based on the requirements of the AQA and OCR specifications but is suitable for other examination boards. Individual students may use the material at home for revision purposes or it may be used for classroom teaching if an interactive white board is available. Accompanying notes on this, and the full range of AS and A2 topics, are available from the KNOCKHARDY SCIENCE WEBSITE at... www.knockhardy.org.uk/sci.htm Navigation is achieved by... either clicking on the grey arrows at the foot of each page or using the left and right arrow keys on the keyboard MASS SPECTROMETRY CONTENTS • Prior knowledge • Background information • The basic parts of a mass spectrometer • The four stages of obtaining a spectrum • How different ions are deflected • Calculating molecular masses using mass spectra • Example questions • Test questions • Other uses of mass spectrometry • Check list MASS SPECTROMETRY Before you start it would be helpful to… • know that atoms are made up of protons, neutrons and electrons • know that like charges repel MASS SPECTROMETRY The first mass spectrometer was built in 1918 by Francis W Aston, a student of J J Thomson, the man who discovered the electron. Aston used the instrument to show that there were different forms of the same element. We now call these isotopes. In a mass spectrometer, particles are turned into positive ions, accelerated and then deflected by an electric or magnetic field. The resulting path of ions depends on their ‘mass to charge’ ratio (m/z). Francis Aston Particles with a large m/z value are deflected least those with a low m/z value are deflected most. The results produce a mass spectrum which portrays the different ions in order of their m/z value. USES Mass spectrometry was initially used to show the identity of isotopes. It is now used to calculate molecular masses and characterise new compounds A MASS SPECTROMETER DETECTOR ION SOURCE ANALYSER A mass spectrometer consists of ... an ion source, an analyser and a detector. PARTICLES MUST BE IONISED SO THEY CAN BE ACCELERATED AND DEFLECTED HOW DOES IT WORK? DETECTOR ION SOURCE ANALYSER IONISATION • gaseous atoms are bombarded by electrons from an electron gun and are IONISED • sufficient energy is given to form ions of 1+ charge HOW DOES IT WORK? DETECTOR ION SOURCE ANALYSER IONISATION • gaseous atoms are bombarded by electrons from an electron gun and are IONISED • sufficient energy is given to form ions of 1+ charge ACCELERATION • ions are charged so can be ACCELERATED by an electric field HOW DOES IT WORK? DETECTOR ION SOURCE ANALYSER IONISATION • gaseous atoms are bombarded by electrons from an electron gun and are IONISED • sufficient energy is given to form ions of 1+ charge ACCELERATION • ions are charged so can be ACCELERATED by an electric field DEFLECTION • charged particles will be DEFLECTED by a magnetic or electric field HOW DOES IT WORK? DETECTOR ION SOURCE ANALYSER IONISATION • gaseous atoms are bombarded by electrons from an electron gun and are IONISED • sufficient energy is given to form ions of 1+ charge ACCELERATION • ions are charged so can be ACCELERATED by an electric field DEFLECTION • charged particles will be DEFLECTED by a magnetic or electric field DETECTION • by electric or photographic methods HOW DOES IT WORK? DETECTOR ION SOURCE ANALYSER IONISATION • gaseous atoms are bombarded by electrons from an electron gun and are IONISED • sufficient energy is given to form ions of 1+ charge ACCELERATION • ions are charged so can be ACCELERATED by an electric field DEFLECTION • charged particles will be DEFLECTED by a magnetic or electric field DETECTION • by electric or photographic methods HOW DOES IT WORK? - Deflection 20Ne 21Ne 22Ne HEAVIER ISOTOPES ARE DEFLECTED LESS • the radius of the path depends on the value of the mass/charge ratio (m/z) • ions of heavier isotopes have larger m/z values so follow a larger radius curve • as most ions are 1+charged, the amount of separation depends on their mass HOW DOES IT WORK? - Deflection 20Ne 2+ ions 22Ne 1+ ions 20Ne ABUNDANCE 21Ne 22Ne HEAVIER ISOTOPES ARE DEFLECTED LESS 0 4 8 12 16 20 m/z values Doubling the charge, halves the m/z value Abundance stays the same • the radius of the path depends on the value of the mass/charge ratio (m/z) • ions of heavier isotopes have larger m/z values so follow a larger radius curve • as most ions are 1+charged, the amount of separation depends on their mass • if an ion acquires a 2+ charge it will be deflected more; its m/z value is halved WHAT IS A MASS SPECTRUM? 20Ne 90.92% MASS SPECTRUM OF NEON 21Ne 0.26% 22Ne 19 20 21 22 8.82% 23 In early research with a mass spectrograph, Aston (Nobel Prize, 1922) demonstrated that naturally occurring neon consisted of three isotopes ... 20Ne, 21Ne and 22Ne. • positions of the peaks gives atomic mass • peak intensity gives the relative abundance • highest abundance is scaled to 100% and other values are adjusted accordingly EXAMPLE CALCULATION (1) Calculate the average relative atomic mass of neon using data on the previous page. Out of every 100 atoms... Average = 90.92 are 20Ne , 0.26 are 21Ne and 8.82 are 22Ne (90.92 x 20) + (0.26 x 21) + (8.82 x 22) = 20.179 Ans. = 20.18 100 TIP In calculations of this type... multiply each relative mass by its abundance add up the total of these values divide the result by the sum of the abundances * if the question is based on percentage abundance, divide by 100 but if it is based on heights of lines in a mass spectrum, add up the heights of the lines and then divide by that number (see later). EXAMPLE CALCULATION (2) Naturally occurring potassium consists of potassium-39 and potassium-41. Calculate the percentage of each isotope present if the average is 39.1. Assume that there are x nuclei of so 39x + 41 (100-x) = 39.1 39K in every 100; there will then be (100-x) of therefore 39 x + 4100 - 41x = 3910 100 thus - 2x = - 190 so x = 95 Ans. 95% 39K and 5% 41K 41K. TEST QUESTION Redraw the diagram with the most abundant isotope scaled up to 100%. Calculate the average relative atomic mass. 100% ABUNDANCE A mass spectrum shows the presence of two isotopes of m/z values 38 and 40. Both have been formed as unipositive ions. 60% 40% 0 10 20 30 40 m/z values What would be a) the m/z values and b) the abundance if 2+ ions had been formed? ANSWERS ON NEXT PAGE TEST QUESTION Redraw the diagram with the most abundant isotope scaled up to 100%. Calculate the average relative atomic mass. 100% ABUNDANCE A mass spectrum shows the presence of two isotopes of m/z values 38 and 40. Both have been formed as unipositive ions. 60% 40% 0 10 20 30 40 m/z values What would be a) the m/z values and b) the abundance if 2+ ions had been formed? New scale atoms of mass 38; abundance = 100 atoms of mass 40; abundance = 66.7 Average = (100 x 38) + (66.7 x 40) = 38.80 166.7 By doubling the charge to 2+, m/z value is halved; new peaks at 19 and 20. The abundance is the same. 100% ABUNDANCE The new values are 100 and 66.7 (see diagram) 100% 66.7% 0 10 20 30 40 m/z values OTHER USES OF MASS SPECTROMETRY - MOLECULAR MASS DETERMINATION Nowadays, mass spectrometry is used to identify unknown or new compounds. IONISATION When a molecule is ionised it forms a MOLECULAR ION which can also undergo FRAGMENTATION or REARRANGEMENT to produce particles of smaller mass. MOLECULAR ION FRAGMENTION Only particles with a positive charge will be deflected and detected. RE-ARRANGEMENT FRAGMENTION The resulting spectrum has many peaks. The final peak (M+) shows the molecular ion (highest m/z value) and indicates the molecular mass. The rest of the spectrum provides information about the structure. MASS SPECTRUM OF C2H5Br The final peak in a mass spectrum is due to the molecular ion. In this case there are two because Br has two main isotopes. As each is of equal abundance, the peaks are the same size. molecular ion contains...79Br 81Br IDENTIFY THE PEAKS IDENTIFY THE PEAKS IDENTIFY THE PEAKS OTHER USES OF MASS SPECTROMETRY - SPACE EXPLORATION Mass spectrometry is used on space probes to identify elements and compounds on the surface of planets. In August and September 1975 the USA launched Viking 1 and 2. Both probes entered Mars orbit to map the planet, dropping landers that transmitted pictures, acted as weather and scientific stations and analysed the Martian soil. VIKING LANDER THE MARTIAN SURFACE REVISION CHECK What should you be able to do? Recall the four basic stages in obtaining a mass spectrum Understand what happens during each of the above four stages Understand why particles need to be in the form of ions Recall the the meaning of mass to charge ratio (m/z) Explain how the mass/charge value affects the path of a deflected ion Interpret a simple mass spectrum and calculate the average atomic mass Understand how mass spectrometry can be used to calculate molecular mass Recall that mass spectrometry can be used to in space exploration Recall other uses of mass spectrometry CAN YOU DO ALL OF THESE? YES NO You need to go over the relevant topic(s) again Click on the button to return to the menu WELL DONE! Try some past paper questions MASS SPECTROMETRY The End © 2015 KNOCKHARDY PUBLISHING
