Math 256 Confidence Interval Project Names:
advertisement
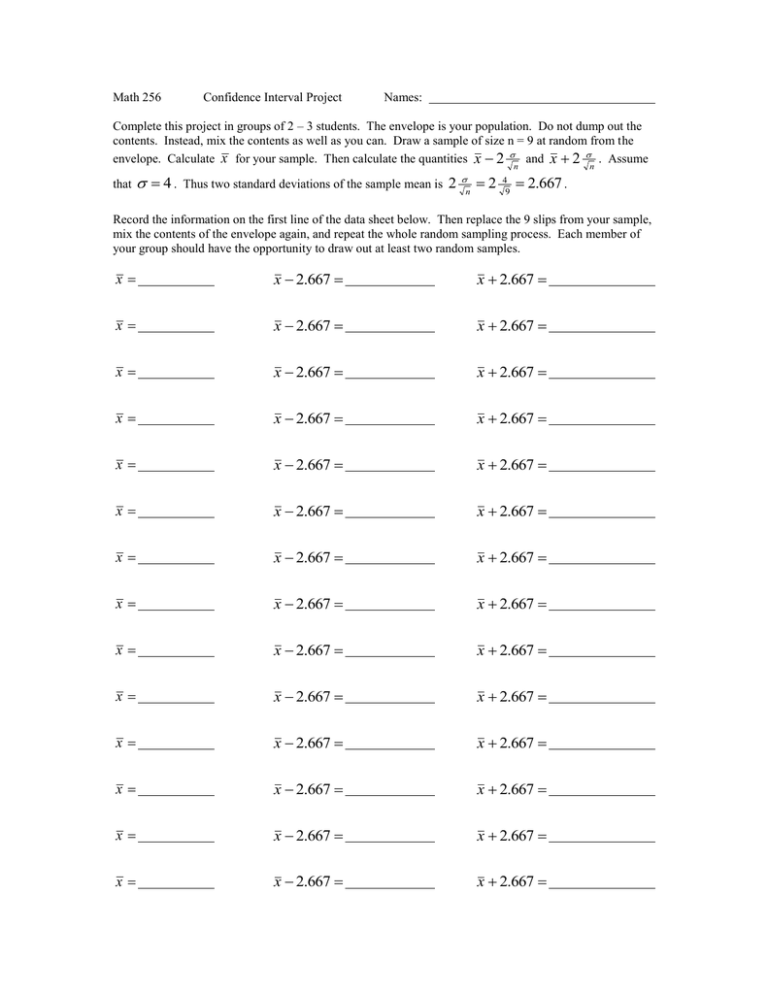
Math 256 Confidence Interval Project Names: Complete this project in groups of 2 – 3 students. The envelope is your population. Do not dump out the contents. Instead, mix the contents as well as you can. Draw a sample of size n = 9 at random from the envelope. Calculate x for your sample. Then calculate the quantities x 2 and x 2 . Assume n that 4. Thus two standard deviations of the sample mean is 2 n 2 4 9 n 2.667 . Record the information on the first line of the data sheet below. Then replace the 9 slips from your sample, mix the contents of the envelope again, and repeat the whole random sampling process. Each member of your group should have the opportunity to draw out at least two random samples. x x 2.667 x 2.667 x x 2.667 x 2.667 x x 2.667 x 2.667 x x 2.667 x 2.667 x x 2.667 x 2.667 x x 2.667 x 2.667 x x 2.667 x 2.667 x x 2.667 x 2.667 x x 2.667 x 2.667 x x 2.667 x 2.667 x x 2.667 x 2.667 x x 2.667 x 2.667 x x 2.667 x 2.667 x x 2.667 x 2.667 1. What is the Confidence Level? 2. The mean of your population is 3. What percent of your confidence intervals contain the mean? . How many of your confidence intervals contain the mean?


