Exam 2 – Fin 5324 – Statement Analysis Fall 2012...
advertisement
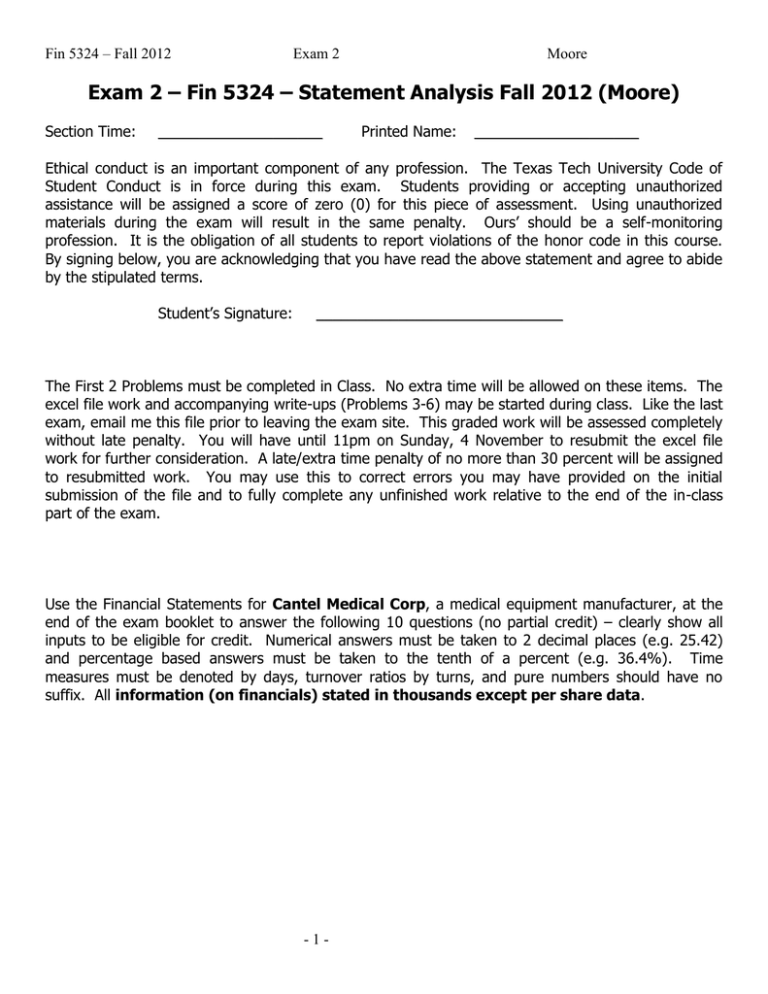
Fin 5324 – Fall 2012 Exam 2 Moore Exam 2 – Fin 5324 – Statement Analysis Fall 2012 (Moore) Section Time: ____________________ Printed Name: ____________________ Ethical conduct is an important component of any profession. The Texas Tech University Code of Student Conduct is in force during this exam. Students providing or accepting unauthorized assistance will be assigned a score of zero (0) for this piece of assessment. Using unauthorized materials during the exam will result in the same penalty. Ours’ should be a self-monitoring profession. It is the obligation of all students to report violations of the honor code in this course. By signing below, you are acknowledging that you have read the above statement and agree to abide by the stipulated terms. Student’s Signature: ______________________________ The First 2 Problems must be completed in Class. No extra time will be allowed on these items. The excel file work and accompanying write-ups (Problems 3-6) may be started during class. Like the last exam, email me this file prior to leaving the exam site. This graded work will be assessed completely without late penalty. You will have until 11pm on Sunday, 4 November to resubmit the excel file work for further consideration. A late/extra time penalty of no more than 30 percent will be assigned to resubmitted work. You may use this to correct errors you may have provided on the initial submission of the file and to fully complete any unfinished work relative to the end of the in-class part of the exam. Use the Financial Statements for Cantel Medical Corp, a medical equipment manufacturer, at the end of the exam booklet to answer the following 10 questions (no partial credit) – clearly show all inputs to be eligible for credit. Numerical answers must be taken to 2 decimal places (e.g. 25.42) and percentage based answers must be taken to the tenth of a percent (e.g. 36.4%). Time measures must be denoted by days, turnover ratios by turns, and pure numbers should have no suffix. All information (on financials) stated in thousands except per share data. -1- Fin 5324 – Fall 2012 Exam 2 Moore Problem 1 (10 Points) (multiple choice at 2.5 points each) 1. Within the context of forecasting, which of the following ratios best links the income statement to the balance sheet? a. Net profit margin b. Current Ratio c. Return on Equity d. Asset Turnover e. Day’s Sales outstanding 2. You have just computed the Beta of a stock to be 1.5 and the estimate the expected market return next period is 7.3333%. The estimated cost of equity is 16%. With an estimated long run market risk premium of 8.0%, what risk free rate supports this cost of equity? a. 2.00% b. 3.00% c. 4.00% d. 5.00% e. 6.00% 3. You are trying to value Cantel (financials on the spreadsheet). Today is November 1, 2012. In one week valuation forecasts will be made. Assume Cantel publishes its 10-K’s no earlier than 6 weeks after the fiscal year end and 10-Q’s no earlier than 2 weeks after the period end, how many quarters of activity must you forecast (in one week) when estimating the annual net income that will be reported on the next published 10-K? a. 0 b. 1 c. 2 d. 3 e. 4 f. 5 4. Which statistic is assess the whether the estimate of Beta significantly differs from zero in a statistical sense? a. Beta b. T-Statistic of the intercept c. T-Statistic of the independent variable d. Adjusted R-squared e. Correlation coefficient -2- Fin 5324 – Fall 2012 Exam 2 Moore Problem 2 (10 Points) (short answers and show work) 1. Compute the stock return for July 2009 using the information below for AIG. Note they had a reverse split of 1:20 on July 4, 2009. (2.5 Points) Date Open High Low Close Mar-2010 27.96 38.45 24.5 34.45 Feb-2010 24.38 29.3 21.54 24.77 Jan-2010 30.53 30.54 23.04 24.23 Dec-2010 29.58 32.8 27.4 29.98 Nov-2010 34.42 40.09 28.04 28.4 Oct-2010 43.57 47.42 33.02 33.62 Sep-2010 41.04 54.4 32.66 44.11 Aug-2010 13.29 55.9 12.97 45.33 Jul-2010 19.65 22.96 8.22 13.14 24-Jul-2009 $ 1.00 Dividend 04-Jul-2009 1 : 20 Stock Split Jun-2009 1.7 1.74 1.08 1.16 2. Use the information above to compute the August 2009 stock return AIG. (2.5 points) 3. Prepare graphs of both the Security Market Line and the Capital Market Line. Label axes and include the investment opportunity set with the efficient frontier. Discuss the implications of borrowing and lending at the risk free rate with the riskless asset. (4 Ponts -3- Fin 5324 – Fall 2012 Exam 2 Moore Problem 3 (20 Points) Prepare Common-Sized Financial Statements for Cantel Corporation for the most recent 6 years. Use the file provided with the exam and update the spreadsheet with this information. Provide a brief discussion (below) regarding assumptions you have made regarding the preparation of the common-sized income statement. -4- Fin 5324 – Fall 2012 Exam 2 Moore Problem 4 (20 Points) Prepare a complete Financial Analysis for Cantel Corporation for the most recent 6 years. Prepare, in separate sections, an analysis of the Liquidity, Operating Efficiency, Profitability and Leverage/Capital Structure risk of Cantel. Make sure you clearly associate and identify the specific variables you include in each section. (e.g. Current Ratio is in the Liquidity analysis section.) (compute the ratios on a separate tab in the provided spreadsheet). Make sure to assess the trend performance of each ratio (improving, declining, no change) and then assess to overall category/dimension (e.g. liquidity). Providing an opinion as to the impact of and response to the financial crisis would be appropriate in your brief and concise write-up. Working Capital Retained Earnings Z score 1.2 1.4 Total Assets Total Assets Earnings Before Interest and Taxes 3.3 Total Assets Market Value of Equity 0.6 Book Value of Liabilitie s Sales 1.0 Total Assets Market Cap information (in Millions) for the past 6 10-K’s. 2007 2008 2009 2010 2011 2012 233.36 152.74 257.65 267.83 430.62 692.59 -5- Fin 5324 – Fall 2012 Exam 2 Moore Problem 5 (20 Points) Use the following information (assumptions) to provide forecasts for Cantel Medical (CMN). Assume an asset turnover ratio of 1.20 in 2012 that will grow by 0.02 turns per year from 20132016 and then stabilize. Sales are forecast to grow by 6.6% in 2013, grow by 5.8% in 2014, 8% in 2015, 9% in 2016, and then level at 10% in 2017 forward. Further, assume the forecast current ratio 2.5 in 2013, 2.4 in 2014 and 2.3 from 2015 onward. Non-Current Assets are forecast to be 67% of total assets in 2013, 66% in 2014 and then 65% thereafter. The 2013 gross profit margin is forecast at 42.0% and is forecast to decrease by a half percentage point per year until it reaches 38.0%. Assume net profit margin in 2012 is 8.1% and that it is forecast to decrease by 0.3 percentage points per year until it levels out in 2015 at 7.2%. Finally, Cantel Medical initiated a dividend policy of $0.067 (6.7 cents) per share during the 4th quarter of the 2009 fiscal year. Semi-Annual dividends are forecast at $0.05 during the 2013 fiscal year and then $0.06 in 2014, $0.07 in 2015, $0.08 in 2016 where it is expected to remain for the next 7 years. Days Supply of Inventory was computed to be 76.76 Days for the year ending July 30, 2012 (based on a 365 day year). Management is concerned with this and has announced efforts will be made to reduce inventory to 75 days supply in 2013 and then by 1 day each year until it reaches the target goal of 71 days. You will work with the above assumptions and the additional assumption of no further stock issuances or repurchases for forecast the following: Forecast out the following items for the next 10 years on the spreadsheet provided Sales Cost of Goods Sold Gross Profits Net Profits Total Assets Current Assets Inventory Non-Current Assets Total Liabilities Current Liabilities Non-Current Liabilities Total Shareholder Equity Retained Earnings. -6- Fin 5324 – Fall 2012 Exam 2 Moore Problem 6 (20 Points) Use the monthly share price, dividend and stock split data for Cantel, the price data for the S&P 500 and the Yields to Maturity on the 2-Year Treasury to estimate the 6, 5, 4, 3, and 2 year Betas for the firm from the CAPM model. (Run the regressions) Next, assume an equilibrium market risk premium of 8.5% and the most recent risk-free rate on the 2-Year note of 0.23% to estimate the cost of equity for Cantel for each of the annual windows. Prepare a table with the estimated cost of capital, Betas, explanatory power. Present your tables on the excel file provided in neat form on a separate tab that clearly identifies your work. Comment below (written stuff) on the stability of Beta over the rolling time windows being analyzed. -7-
