Template to Report Results of Assessment of General Education Learning... Academic Year 2011-12 Subject Area: Mathematics
advertisement
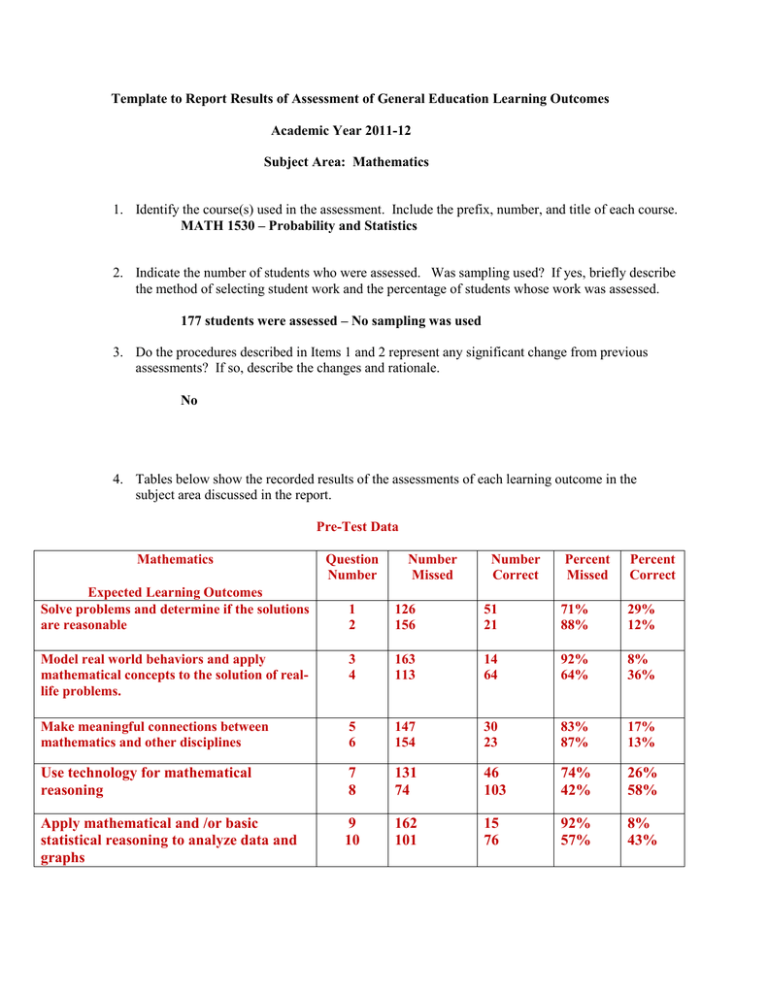
Template to Report Results of Assessment of General Education Learning Outcomes Academic Year 2011-12 Subject Area: Mathematics 1. Identify the course(s) used in the assessment. Include the prefix, number, and title of each course. MATH 1530 – Probability and Statistics 2. Indicate the number of students who were assessed. Was sampling used? If yes, briefly describe the method of selecting student work and the percentage of students whose work was assessed. 177 students were assessed – No sampling was used 3. Do the procedures described in Items 1 and 2 represent any significant change from previous assessments? If so, describe the changes and rationale. No 4. Tables below show the recorded results of the assessments of each learning outcome in the subject area discussed in the report. Pre-Test Data Mathematics Expected Learning Outcomes Solve problems and determine if the solutions are reasonable Question Number Number Missed Number Correct Percent Missed Percent Correct 1 2 126 156 51 21 71% 88% 29% 12% Model real world behaviors and apply mathematical concepts to the solution of reallife problems. 3 4 163 113 14 64 92% 64% 8% 36% Make meaningful connections between mathematics and other disciplines 5 6 147 154 30 23 83% 87% 17% 13% Use technology for mathematical reasoning 7 8 131 74 46 103 74% 42% 26% 58% Apply mathematical and /or basic statistical reasoning to analyze data and graphs 9 10 162 101 15 76 92% 57% 8% 43% Post – Test Data Mathematics Question Number Number Missed Expected Learning Outcomes Solve problems and determine if the solutions are reasonable Number Correct Percent Missed Percent Correct 1 2 68 107 109 70 38% 60% 62% 40% Model real world behaviors and apply mathematical concepts to the solution of real-life problems. Make meaningful connections between mathematics and other disciplines 3 4 72 95 105 82 41% 54% 59% 46% 5 6 62 84 115 93 35% 47% 65% 53% Use technology for mathematical reasoning 7 8 107 24 70 153 60% 14% 40% 86% Apply mathematical and /or basic statistical reasoning to analyze data and graphs 9 10 62 11 115 166 35% 6% 65% 94% 5. Summarize your impressions of the results reported in item 4. Based upon your interpretation of the data, what conclusions emerge about student attainment of the learning outcomes? The assessment table (Attached) shows no Unsatisfactory, each SLO had either a Satisfactory of Superior outcome. In the Expected Learning Outcomes (Number 4): “Solve problems and determine if the solutions are reasonable” – The more thought provoking problem is harder for the student to understand and the majority missed the problem “Model real world behaviors and apply mathematical concepts to the solution of real-life problems” – When more than one step is applied to the problem, the students have a harder time solving the problem “Use technology for mathematical reasoning” – Using the calculator does not automatically mean the student will get the problem correct. This question is from the first of the semester and is not used again during the semester. 6. Do you plan to implement strategies to correct any deficiencies that emerged from the data obtained? If yes, please explain. Yes, the Mathematics Department will reevaluate the questions in the three Expected Learning Outcomes stated in # 5. Also, the department will look at the validity of question 7 on the test. A concept stated at the first of the semester and not again during the semester, where other concepts are built upon to see the “bigger picture”, might there be a better question? 7. Did you implement any plans to correct deficiencies based upon data obtained from the assessment of 2010-11? If yes, please explain. No

