Econ 201/202 In- Class Exercise – Graphs and Economics
advertisement
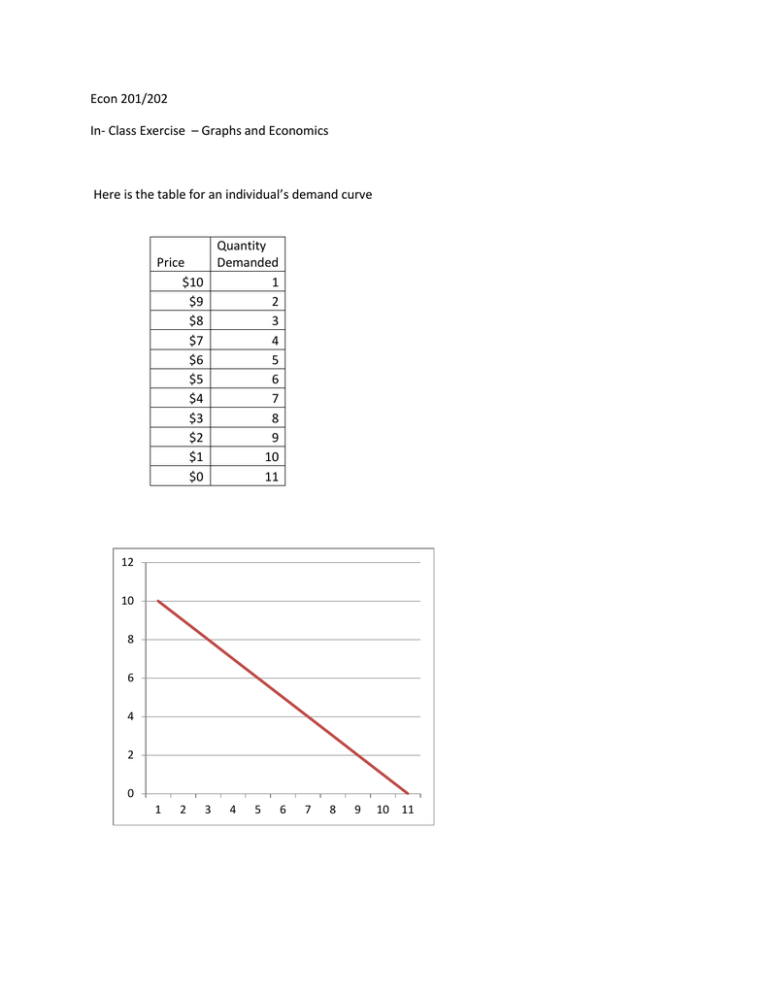
Econ 201/202 In- Class Exercise – Graphs and Economics Here is the table for an individual’s demand curve Quantity Demanded 1 2 3 4 5 6 7 8 9 10 11 Price $10 $9 $8 $7 $6 $5 $4 $3 $2 $1 $0 12 10 8 6 4 2 0 1 2 3 4 5 6 7 8 9 10 11 1. 2. 3. 4. Calculate the slope of this demand curve What does the magnitude (size) of the slope coefficient tell you? Why would the quantity demanded only be 11 units when the price is $0? What is the marginal (additional or incremental) value of: a. The 1st unit the consumer buys b. The 4th unit the consumer buys c. The 11th unit the consumer buys 5. If the price charged for this good is $5: a. How many units would the consumer buy? b. What is the (marginal) value of the 6th unit to this consumer? c. How much would the consumer have to pay to buy 6 units? d. How would you show this on the graph of the demand curve? e. How much would the consumer have been willing to pay for all 5 units, i.e., what was their maximum willingness to pay for 6 units (rather than go without)? f. How could you show this on the demand graph?
