Document 15590608
advertisement
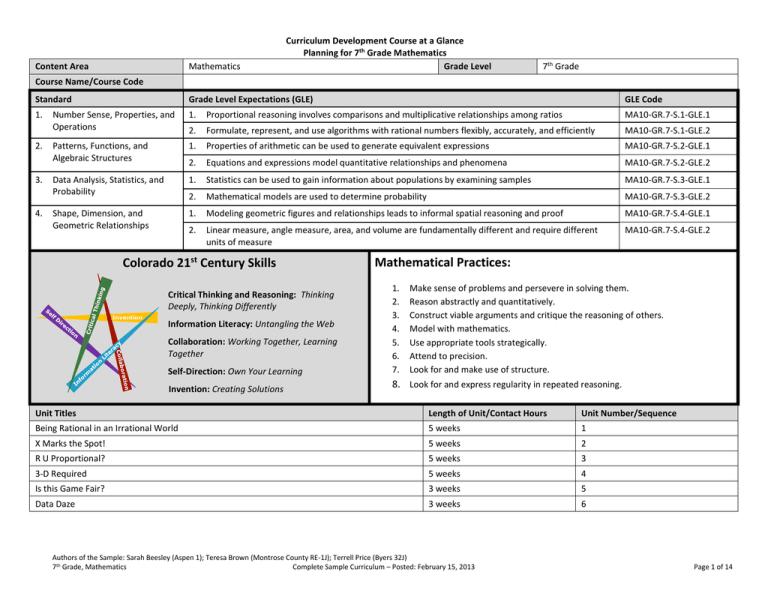
Content Area Mathematics Curriculum Development Course at a Glance Planning for 7th Grade Mathematics Grade Level 7th Grade Course Name/Course Code Standard Grade Level Expectations (GLE) GLE Code 1. Number Sense, Properties, and Operations 1. Proportional reasoning involves comparisons and multiplicative relationships among ratios MA10-GR.7-S.1-GLE.1 2. Formulate, represent, and use algorithms with rational numbers flexibly, accurately, and efficiently MA10-GR.7-S.1-GLE.2 Patterns, Functions, and Algebraic Structures 1. Properties of arithmetic can be used to generate equivalent expressions MA10-GR.7-S.2-GLE.1 2. Equations and expressions model quantitative relationships and phenomena MA10-GR.7-S.2-GLE.2 Data Analysis, Statistics, and Probability 1. Statistics can be used to gain information about populations by examining samples MA10-GR.7-S.3-GLE.1 2. Mathematical models are used to determine probability MA10-GR.7-S.3-GLE.2 Shape, Dimension, and Geometric Relationships 1. Modeling geometric figures and relationships leads to informal spatial reasoning and proof MA10-GR.7-S.4-GLE.1 2. Linear measure, angle measure, area, and volume are fundamentally different and require different units of measure MA10-GR.7-S.4-GLE.2 2. 3. 4. Colorado 21st Century Skills Self-Direction: Own Your Learning 1. 2. 3. 4. 5. 6. 7. Invention: Creating Solutions 8. Look for and express regularity in repeated reasoning. Critical Thinking and Reasoning: Thinking Deeply, Thinking Differently Invention Mathematical Practices: Information Literacy: Untangling the Web Collaboration: Working Together, Learning Together Make sense of problems and persevere in solving them. Reason abstractly and quantitatively. Construct viable arguments and critique the reasoning of others. Model with mathematics. Use appropriate tools strategically. Attend to precision. Look for and make use of structure. Unit Titles Length of Unit/Contact Hours Unit Number/Sequence Being Rational in an Irrational World 5 weeks 1 X Marks the Spot! 5 weeks 2 R U Proportional? 5 weeks 3 3-D Required 5 weeks 4 Is this Game Fair? 3 weeks 5 Data Daze 3 weeks 6 Authors of the Sample: Sarah Beesley (Aspen 1); Teresa Brown (Montrose County RE-1J); Terrell Price (Byers 32J) 7th Grade, Mathematics Complete Sample Curriculum – Posted: February 15, 2013 Page 1 of 14 Curriculum Development Overview Unit Planning for 7th Grade Mathematics Unit Title Being Rational in an Irrational World Focusing Lens(es) Representation Interpretation Inquiry Questions (EngagingDebatable): Unit Strands The Number System, Expressions and Equations Concepts Sum, distance, positive, negative, direction, additive inverse, subtraction, rational numbers, absolute value, difference, number line, decimal, equivalence, terminating decimal, repeating decimal, fraction, numerator, denominator, multiplication, division, distributive property, signed numbers, products, quotients, integers, Length of Unit Standards and Grade Level Expectations Addressed in this Unit 5 weeks MA10-GR.7-S.1-GLE.2 MA10-GR.7-S.2-GLE.2 What does it mean to “be in the red?” (MA10-GR.7-S.1-GLE.2-RA.1) Do two negatives always make a positive? Generalizations My students will Understand that… Guiding Questions Factual Conceptual Every quotient of integers produces rational numbers provided that the divisor is not zero. (MA10-GR.7-S.1GLE.2-EO.b.iii) What is an integer? What is a rational number? How can you show 1/7 is rational? What are examples of irrational numbers? Why is p/0 undefined? Why does the quotient of integers produce a rational numbers provided that the divisor is not zero? Mathematicians express rational numbers in fractional form as a decimal equivalent that either terminates or eventually repeats (MA10-GR.7-S.1-GLE.2-EO.b.iv) How do calculate the decimal equivalent for a fraction? Why do some fractions convert to terminating decimals and others repeating decimals? (MA10-GR.7-S.1-GLE.2IQ.4) Mathematicians interpret the sum of rational numbers, p + q, as a number located a distance |q| from p, in the positive or negative direction (MA10-GR.7-S.1-GLE.2EO.a.iii) How can number lines help visualize the possible answers to an addition problem? When adding, why is it possible for the sum to be smaller than the initial quantity? How do you determine whether to move in the positive or negative direction from an initial quantity when adding? Mathematicians use additive inverses to interpret subtraction of rational numbers as adding the additive inverse, p – q = p + (-q). (MA10-GR.7-S.1-GLE.2-EO.a.iv) What are additive inverses? What are situations in which opposite quantities combine to make 0? How can you use additive inverses to subtract rational numbers? Why do additive inverses have a sum of zero? Why is subtraction of rational numbers equivalent to adding the additive inverse, p – q = p + (-q)? Authors of the Sample: Sarah Beesley (Aspen 1); Teresa Brown (Montrose County RE-1J); Terrell Price (Byers 32J) 7th Grade, Mathematics Complete Sample Curriculum – Posted: February 15, 2013 Page 2 of 14 Curriculum Development Overview Unit Planning for 7th Grade Mathematics Mathematicians represent the absolute value of the difference between to rational numbers as the distance between the numbers on a number line. (MA10-GR.7-S.1GLE.2-EO.a.vii) How can you represent the distance between two numbers on a number line? If you know the absolute value distance between two numbers, how can you determine if the difference between the two numbers is positive or negative? Why is |p – q| equivalent to |q – p|? Fraction multiplication and division extends to rational numbers. (MA10-GR.7-S.1-GLE.2-EO.b) What are real world examples of multiplication of rational numbers, including negative rational numbers? How does the distributive property help us understand (-1)(-1) = 1 and the rules for multiplying signed numbers and quotients such as –(p/q) = (-p)/q = p/(q)? Why is a negative number multiplied by a negative equal to a positive? How do the properties of operations for fraction multiplication extend to rational numbers? (MA10GR.7-S.1-GLE.2-IQ.1) Key Knowledge and Skills: My students will… What students will know and be able to do are so closely linked in the concept-based discipline of mathematics. Therefore, in the mathematics samples what students should know and do are combined. Describe situations in which opposite quantities combine to make 0. (MA10-GR.7-S.1-GLE.2-EO.a.i) Understand p + q as the number located a distance |q| from p, in the positive or negative direction depending on whether q is positive or negative (MA10-GR.7-S.1-GLE.2EO.a.iii) Show that a number and its opposite have a sum of 0 (are additive inverses) (MA10-GR.7-S.1-GLE.2-EO.a.iv) Understand subtraction of rational numbers as adding the additive inverse, p – q = p + (–q) (MA10-GR.7-S.1-GLE.2-EO.a.vi) Show that the distance between two rational numbers on the number line is the absolute value of their difference, and apply this principle in real-world contexts. (MA10GR.7-S.1-GLE.2-EO.a.vii) Apply properties of operations as strategies to add and subtract rational numbers. (MA10-GR.7-S.1-GLE.2-EO.a.viii) Understand multiplication is extended from fractions to rational numbers by requiring that operations continue to satisfy the properties of operations, particularly the distributive property, leading to products such as (–1)(–1) = 1 and the rules for multiplying signed numbers (MA10-GR.7-S.1-GLE.2-EO.b.i) Understand integers can be divided, provided the divisor is not zero, and every quotient of integers (with non-zero divisor) is a rational number; if p and q are integers, then – (p/q) = (–p)/q = p/(–q) (MA10-GR.7-S.1-GLE.2-EO.b.iii) Interpret sums, products and quotients of rational numbers by describing real-world contexts (MA10-GR.7-S.1-GLE.2-EO.a.v, b.ii, b.iii) Apply properties of operations as strategies to multiply and divide rational numbers. (MA10-GR.7-S.1-GLE.2-EO.b.iii, b.iv) Convert a rational number to a decimal using long division; know that the decimal form of a rational number terminates in 0s or eventually repeats (MA10-GR.7-S.1-GLE.2EO.b.v) Solve real-world and mathematical problems involving the four operations with rational numbers. (MA10-GR.7-S.1-GLE.2-EO.c) Solve multi-step real-life and mathematical problems posed with positive and negative rational numbers in any form (whole numbers, fractions, and decimals), using tools strategically. (MA10-GR.7-S.2-GLE.2-EO.a) Apply properties of operations to calculate with numbers in any form; convert between forms as appropriate; and assess the reasonableness of answers using mental computation and estimation strategies. (MA10-GR.7-S.2-GLE.2-EO.b) Authors of the Sample: Sarah Beesley (Aspen 1); Teresa Brown (Montrose County RE-1J); Terrell Price (Byers 32J) 7th Grade, Mathematics Complete Sample Curriculum – Posted: February 15, 2013 Page 3 of 14 Curriculum Development Overview Unit Planning for 7th Grade Mathematics Critical Language: includes the Academic and Technical vocabulary, semantics, and discourse which are particular to and necessary for accessing a given discipline. EXAMPLE: A student in Language Arts can demonstrate the ability to apply and comprehend critical language through the following statement: “Mark Twain exposes the hypocrisy of slavery through the use of satire.” A student in ______________ can demonstrate the ability to apply and comprehend critical language through the following statement(s): I know every rational number written as a fraction has a decimal equivalent that either terminates or repeats. I know the distance between 3 and -5 is the same as the distance from -5 and 3, which is the absolute value difference. Academic Vocabulary: Describe, show, apply, convert, solve, strategic, , distance, positive, negative, direction subtraction, fraction, multiplication, division, Technical Vocabulary: Sum, additive inverse, rational numbers, absolute value, difference, number line, decimal, equivalence, terminating decimal, repeating decimal, numerator, denominator, distributive property, signed numbers, products, quotients, integers, opposite quantities, Authors of the Sample: Sarah Beesley (Aspen 1); Teresa Brown (Montrose County RE-1J); Terrell Price (Byers 32J) 7th Grade, Mathematics Complete Sample Curriculum – Posted: February 15, 2013 Page 4 of 14 Curriculum Development Overview Unit Planning for 7th Grade Mathematics Unit Title X Marks the Spot! Focusing Lens(es) Equivalence Comparison Inquiry Questions (EngagingDebatable): Unit Strands Expressions and Equations Concepts Equivalent, expressions, inequalities, properties of operations, addition, subtraction, multiplication, division, factoring, expansion, arithmetic solution strategy, algebraic solution strategy, arithmetic operations, algebraic equations, correctness, algebraic manipulations, operation, both sides, negative number, reverse Length of Unit Standards and Grade Level Expectations Addressed in this Unit 5 weeks MA10-GR.7-S.2-GLE.1 MA10-GR.7-S.2-GLE.2 Why are there different ways to solve equations? (MA10-GR.7-S.2-GLE.2-IQ.2) Generalizations My students will Understand that… Guiding Questions Factual Conceptual Mathematicians generate equivalent expressions by applying properties of operations to shed light on a problem context and the relationships between quantities. (MA10-GR.7-S.2-GLE.1-EO.a.i, a.ii) What is an expression? How is it determined that two algebraic expressions are equivalent? (MA10-GR.7-S.2-GLE.1-IQ.2) How do symbolic transformations affect an expression?(MA10-GR.7-S.2-GLE.1-IQ.1) How does rewriting the expression shed light on how the quantities in the problem are related? Comparing arithmetic and algebraic solution strategies provides a basis for checking the correctness of algebraic manipulations. (MA10-GR.7-S.2-GLE.2-EO.c.i, c.ii) What does it mean to solve an equation arithmetically? How can substituting a value for x to allow for arithmetic operations assist in the solving of algebraic equations? Why do properties of operations work with numbers and variables? (MA10-GR.7-S.2-GLE.2-IQ.1) Generating equivalent inequalities requires applying the same operations in the same order to both sides of an inequality. (MA10-GR.7-S.2-GLE.2-EO.c.iii, c.iv) What is an inequality? How is it determined if inequalities written differently are equivalent? How can you graph the solution set of an inequality? What are examples of context that produce inequalities with infinitely or finitely many solutions? Why is it necessary to carry out operations in the same order to both sides of inequality to generate an equivalent inequality? Why does multiplying or dividing by a negative number reverse the inequality sign? Why is it important to check a value from the solution set of an inequality in the original inequality? Authors of the Sample: Sarah Beesley (Aspen 1); Teresa Brown (Montrose County RE-1J); Terrell Price (Byers 32J) 7th Grade, Mathematics Complete Sample Curriculum – Posted: February 15, 2013 Page 5 of 14 Curriculum Development Overview Unit Planning for 7th Grade Mathematics Key Knowledge and Skills: My students will… What students will know and be able to do are so closely linked in the concept-based discipline of mathematics. Therefore, in the mathematics samples what students should know and do are combined. Apply properties of operations as strategies to add, subtract, factor, and expand linear expressions with rational coefficients. (MA10-GR.7-S.2-GLE.1-EO.a.i) Understand that rewriting an expression in different forms in a problem context can shed light on the problem and how the quantities in it are related Solve word problems leading to equations of the form px + q = r and p(x + q) = r, where p, q, and r are specific rational numbers. (MA10-GR.7-S.2-GLE.2-EO.c.i) Fluently solve equations of the form px + q = r and p(x + q) = r, where p, q, and r are specific rational numbers. (MA10-GR.7-S.2-GLE.2-EO.c.i) Compare an algebraic solution to an arithmetic solution, identifying the sequence of the operations used in each approach. (MA10-GR.7-S.2-GLE.2-EO.c.ii) Solve word problems leading to inequalities of the form px + q > r or px + q < r, where p, q, and r are specific rational numbers. (MA10-GR.7-S.2-GLE.2-EO.c.iii) Graph the solution set of an inequality and interpret it in the context of the problem. (MA10-GR.7-S.2-GLE.2-EO.c.iv) Critical Language: includes the Academic and Technical vocabulary, semantics, and discourse which are particular to and necessary for accessing a given discipline. EXAMPLE: A student in Language Arts can demonstrate the ability to apply and comprehend critical language through the following statement: “Mark Twain exposes the hypocrisy of slavery through the use of satire.” A student in ______________ can demonstrate the ability to apply and comprehend critical language through the following statement(s): When generating an equivalent inequality I need to reverse the inequality if I multiply or divide by a negative, for example 25 < 32 but if I multiply both sides by -1, the new inequality becomes -25 > -35, notice the inequality sign had to change to keep it true. Academic Vocabulary: Identify, interpret, apply, solve, fluently, compare, graph, addition, subtraction, multiplication, division, equal, correctness, reverse Technical Vocabulary: Equivalent, expressions, inequalities, properties of operations, factoring, expansion, arithmetic solution strategy, algebraic solution strategy, arithmetic operations, algebraic equations, algebraic manipulations, operation, both sides, negative number, Authors of the Sample: Sarah Beesley (Aspen 1); Teresa Brown (Montrose County RE-1J); Terrell Price (Byers 32J) 7th Grade, Mathematics Complete Sample Curriculum – Posted: February 15, 2013 Page 6 of 14 Curriculum Development Overview Unit Planning for 7th Grade Mathematics Unit Title R U Proportional? Focusing Lens(es) Relationships Interpret Inquiry Questions (EngagingDebatable): Unit Strands Ratios and Proportional Relationships, Geometry, Personal Financial Literacy Concepts Constant of proportionality, unit rate, ratio, proportional relationships, ratio tables, coordinate graphs, proportional context, rate of increase, equations Length of Unit Standards and Grade Level Expectations Addressed in this Unit 5 weeks MA10-GR.7-S.1-GLE.1 A store is having a 25% off sale and if you have a coupon you can take an additional 25% off, does that make the item half off? (MA10-GR.7-S.1-GLE.1EO.d)* Generalizations My students will Understand that… Guiding Questions Factual Conceptual The constant of proportionality (unit rate) describes the ratio between two quantities in a particular context. (MA10-GR.7-S.1-GLE.1-EO.c.ii) What is a proportion? How is the constant of proportionality calculated? What are the different ways the constant of proportionality is represented? Why is it important to keep track of the order of proportionality when analyzing relationships? Why can the constant of proportionality be expressed in two ways? Why is the unit ratio equivalent to the constant of proportionality? Mathematicians verify proportional relationships by examining ratio tables and coordinate graphs. (MA10GR.7-S.1-GLE.1-EO.c.i, c.ii) How can you determine if two ratios are in a proportional relationship by using a ratio table? How is the constant of proportionality visible in the graph of a proportional relationship? Why can you determine from only two points and origin whether something is a proportional relationship? Any point (x,y) on the graph y=kx satisfies a proportional relationship with the constant of proportionality k. (MA10-GR.7-S.1-GLE.1-EO.c.iii) How can you represent proportional relationships by equations? Why is k the constant of proportionality in the equation y=kx? Mathematicians interpret the points (x,y), (0,0) and (1,r) in relation to a proportional context, where r is the unit rate. (MA10-GR.7-S.1-GLE.1-EO.c.iv) How can you tell if an equation for a proportional relation will be above or below the line y=x when graphed? Why is the point (1, r) a point on the equation y = xr and how does that relate to r being the unit rate? Authors of the Sample: Sarah Beesley (Aspen 1); Teresa Brown (Montrose County RE-1J); Terrell Price (Byers 32J) 7th Grade, Mathematics Complete Sample Curriculum – Posted: February 15, 2013 Page 7 of 14 Curriculum Development Overview Unit Planning for 7th Grade Mathematics The constant of proportionality determines the rate of increase (or decrease) of proportional relationships. (MA10-GR.7-S.1-GLE.1-EO.c) Key Knowledge and Skills: My students will… How can you use a graph to directly comparing multiple constants of proportionality? How do the graphs of y = x compare to the graphs of y= 2x, y = 3x, y=(1/2)x and y = (1/3)x? When describing the relationship among the orientation of a line, unit rate, and the labels of quantities for the x- and y-axes, Why is important to be careful to specify the units of each before stating a generalization about the proportional relationship? What students will know and be able to do are so closely linked in the concept-based discipline of mathematics. Therefore, in the mathematics samples what students should know and do are combined. Compute unit rates associated with ratios of fractions, including ratios of lengths, areas and other quantities measured in like or different units. (MA10-GR.7-S.1-GLE.1-EO.a) Decide whether two quantities are in a proportional relationship, including by testing for equivalent ratios in a table or graphing on a coordinate plane and observing whether the graph is a straight line through the origin. (MA10-GR.7-S.1-GLE.1-EO.c.i) Identify the constant of proportionality (unit rate) in tables, graphs, equations, diagrams, and verbal descriptions of proportional relationships. (MA10-GR.7-S.1-GLE.1-EO.c.ii) Represent proportional relationships by equations. (MA10-GR.7-S.1-GLE.1-EO.c.iii) Explain what a point (x, y) on the graph of a proportional relationship means in terms of the situation, with special attention to the points (0, 0) and (1, r) where r is the unit rate. (MA10-GR.7-S.1-GLE.1-EO.c.iv) Use proportional relationships to solve multistep ratio and percent problems. (MA10-GR.7-S.1-GLE.1-EO.d) Estimate and compute unit cost of consumable (to include unit conversations if necessary) sold in quantity to make purchase decisions based on cost and practicality. (MA10GR.7-S.1-GLE.1-EO.d.i) Solve problems involving percent of a number, discounts, taxes, simple interest, percent increase, and percent decrease. (MA10-GR.7-S.1-GLE.1-EO.d.ii) Critical Language: includes the Academic and Technical vocabulary, semantics, and discourse which are particular to and necessary for accessing a given discipline. EXAMPLE: A student in Language Arts can demonstrate the ability to apply and comprehend critical language through the following statement: “Mark Twain exposes the hypocrisy of slavery through the use of satire.” A student in ______________ can demonstrate the ability to apply and comprehend critical language through the following statement(s): The constant of proportional can be represented in an equation of the form y= kx where k is the constant of proportionality, on a graph where the constant of proportionality is represented in the steepness of the line, and in a ratio table as unit rates. Academic Vocabulary: Compute, identify, represent, explain, estimate, solve, unit cost, practicality, discount, taxes, percent increase, percent decrease, simple interest, consumables, tables, percent Technical Vocabulary: Constant of proportionality, unit rate, ratio, proportional relationships, ratio tables, coordinate graphs, proportional context, rate of increase proportion, equations, *Denotes a connection to Personal Financial Literacy (PFL) Authors of the Sample: Sarah Beesley (Aspen 1); Teresa Brown (Montrose County RE-1J); Terrell Price (Byers 32J) 7th Grade, Mathematics Complete Sample Curriculum – Posted: February 15, 2013 Page 8 of 14 Curriculum Development Overview Unit Planning for 7th Grade Mathematics Unit Title 3-D Required Focusing Lens(es) Relationships Visualization Inquiry Questions (EngagingDebatable): Unit Strands Geometry Concepts Circumference, area, circle, diameter, π, ratio, radius, slice, three-dimensional figures, two-dimensional figures, scale factor, magnification, zoom level, scale drawings, characteristics, drawing, tools (rulers, protractors, compasses), complementary, supplementary, adjacent, vertical, angles, indirect measurement, additive property, area, volume, decomposition, composition Length of Unit Standards and Grade Level Expectations Addressed in this Unit 5 weeks MA10-GR.7-S.4-GLE.1 MA10-GR.7-S.4-GLE.2 Why is pi an important number? (MA10-GR.7-S.4-GLE.2-IQ.8) How many two-dimensional shapes can you make by slicing a three-dimensional object? Generalizations My students will Understand that… Guiding Questions Factual Conceptual Mathematicians recognize the special relationship between the diameter and circumference of a circle as the ratio called π, and utilize this relationship to calculate the area, circumference, diameter or radius of a circle. (MA10-GR.7-S.4-GLE.2-EO.a, b) What is the radius? What is the formula for finding the circumference of a circle? What is the formula for finding the area of a circle? What is π? How are the circumference and diameter of a circle related? How does the derivation of the formula for the area of a circle rely on both the circumference and radius of the circle? Slicing three-dimensional figures results in twodimensional figures (MA10-GR.7-S.4-GLE.1-EO.a.iv) What types of two-dimensional figures can be created when slicing a cone? How does slicing a 3-D shape parallel to the base differ from slicing the same 3-D shape diagonal to the base? Mathematicians represent scale factor in terms of magnification or zoom level. (MA10-GR.7-S.4-GLE.1EO.a.i) How does scale factor affect length, perimeter, angle measure, area, and volume? (MA10-GR.7-S.4-GLE.1IQ.3) Why is the scale factor for side lengths and perimeters different from the one for areas? Mathematicians draw geometric figure using rulers, protractors, and compasses with precision (MA10-GR.7S.4-GLE.1-EO.a.ii, a.iii) How is sketching different from drawing? When drawing triangles, when do provided characteristics lead to no triangle, exactly one or more than one possible triangle? Is there a geometric figure for any given set of attributes? (MA10-GR.7-S.4-GLE.1-IQ.1) Why are rulers, protractors and compasses necessary when drawing shapes? Authors of the Sample: Sarah Beesley (Aspen 1); Teresa Brown (Montrose County RE-1J); Terrell Price (Byers 32J) 7th Grade, Mathematics Complete Sample Curriculum – Posted: February 15, 2013 Page 9 of 14 Curriculum Development Overview Unit Planning for 7th Grade Mathematics Angle relationships such as complementary, supplementary, adjacent and vertical angles provide mathematicians an indirect means to solve for unknown angles in a figure (MA10-GR.7-S.4-GLE.2-EO.c) What are complementary angles? What are supplementary angles? What are adjacent angles? What are vertical angles? How do line relationships affect angle relationships? How can you indirectly determine the measurement of an unknown angle formed by two intersecting lines? How can geometric relationships among lines and angles be generalized, described, and quantified? (MA10GR.7-S.4-GLE.2-IQ.1) The additive property of area and volume provides a means for deriving equations to find the surface area and volume of two -and three-dimensional objects (MA10GR.7-S.4-GLE.2-EO.d) What are examples of familiar shapes that are helpful to recognize within larger objects when trying to find volumes or surface areas? What do surface area and volume tell about an object? (MA10-GR.7-S.4-GLE.2-IQ.6) Why area and volume both have additive properties of composition and decomposition? How can two shapes have the same volume but different surface areas and vice versa? (MA10-GR.7-S.4-GLE.2IQ.2, 3) Key Knowledge and Skills: My students will… What students will know and be able to do are so closely linked in the concept-based discipline of mathematics. Therefore, in the mathematics samples what students should know and do are combined. Solve problems involving scale drawings of geometric figures, including computing actual lengths and areas from a scale drawing and reproducing a scale drawing at a different scale. (MA10-GR.7-S.4-GLE.1-EO.a.i) Draw (freehand, with ruler and protractor, and with technology) geometric shapes with given condition, with focus on triangles from three measures of angles or sides, noting when the conditions determine a unique triangle, more than one triangle, or no triangle. (MA10-GR.7-S.4-GLE.1-EO.a.ii, a.iii) Describe the two-dimensional figures that result from slicing three-dimensional figures, as in plane sections of right rectangular prisms and right rectangular pyramids. (MA10-GR.7-S.4-GLE.1-EO.a.iv) Know the formulas for the area and circumference of a circle and use them to solve problems (MA10-GR.7-S.4-GLE.2-EO.a) Give an informal derivation of the relationship between the circumference and area of a circle. (MA10-GR.7-S.4-GLE.2-EO.b) Use facts about supplementary, complementary, vertical, and adjacent angles in a multi-step problem to write and solve simple equations for an unknown angle in a figure. (MA10-GR.7-S.4-GLE.2-EO.c) Solve real-world and mathematical problems involving area, volume and surface area of two- and three-dimensional objects composed of triangles, quadrilaterals, polygons, cubes, and right prisms. (MA10-GR.7-S.4-GLE.2-EO.d) Critical Language: includes the Academic and Technical vocabulary, semantics, and discourse which are particular to and necessary for accessing a given discipline. EXAMPLE: A student in Language Arts can demonstrate the ability to apply and comprehend critical language through the following statement: “Mark Twain exposes the hypocrisy of slavery through the use of satire.” A student in ______________ can demonstrate the ability to apply and comprehend critical language through the following statement(s): The area of a circle is derived by cutting the circle like a pizza into successively smaller slices and rearranging to form a parallelogram with a base that is half the circumference and a height of the radius. Academic Vocabulary: Solve, draw, freehand, ruler, protractor, triangle, area, circle, angles, polygons cubes, slice, three-dimensional figures, two-dimensional figures, scale factor, magnification, zoom level, scale drawings, characteristics, volume, derive, parallelogram Technical Vocabulary: Circumference, diameter, π, ratio, radius, drawing, tools (rulers, protractors, compasses), complementary angles, supplementary angles, adjacent angles, vertical angles, indirect measurement, additive property, decomposition, composition, congruent quadrilateral, right prisms Authors of the Sample: Sarah Beesley (Aspen 1); Teresa Brown (Montrose County RE-1J); Terrell Price (Byers 32J) 7th Grade, Mathematics Complete Sample Curriculum – Posted: February 15, 2013 Page 10 of 14 Curriculum Development Overview Unit Planning for 7th Grade Mathematics Unit Title Is this Game Fair? Focusing Lens(es) Fairness Experiment Inquiry Questions (EngagingDebatable): Unit Strands Statistics and Probability Concepts Probabilities, likelihood, event, ratio, trials, frequency, outcomes, experimental probability, theoretical probability, simple events, compound events, sample spaces, fraction, Length of Unit Standards and Grade Level Expectations Addressed in this Unit 3 weeks MA10-GR.7-S.3-GLE.2 Is it possible to use probability to predict the future? Why or why not? (MA10-GR.7-S.3-GLE.2-IQ.2) Generalizations My students will Understand that… Guiding Questions Factual Conceptual Mathematicians express probabilities (the likelihood of an event occurring) as a ratio between 0 and 1 where larger numbers indicate greater likelihood. (MA10-GR.7-S.3GLE.2-EO.a, c.ii) What does a probability near 0 indicate? Around ½ indicate? Near 1 indicate? What is an event? An outcome? What words are used to informally describe probability? When is it appropriate to assign equal probabilities to all outcomes? Why is probability reported as a ratio? How is it possible to have two outcomes and not have a 50% chance for each outcome? Why is it important to consider all of the possible outcomes of an event when determining probability? (MA10-GR.7-S.3-GLE.2-IQ.1) Why is a probability greater than 1 not possible? Over large numbers of trials the relative frequency of outcomes (experimental probability) approaches expected (theoretical) probabilities (MA10-GR.7-S.3GLE.2-EO.b, c.i, c.iii, d.iv) What is experimental probability and theoretical probability? How are experimental probabilities generated for simple events? Compound events? Why might an experimental probability differ from a theoretical? Why is it sometimes necessary to calculate experimental probabilities? Exhaustively combining the outcomes of simple events creates compound event sample spaces (MA10-GR.7-S.3GLE.2-EO.d.i, d.iii) What is a sample space? Compound event? What are different ways to represent the sample space of compound events made up of two simpler events? More than two simpler events? Why is it necessary to exhaustively combine simple events to find the sample space of a compound event? Mathematicians find the probability of a compound event by determining the fraction of outcomes in the sample space for which the compound event occurs. (MA10-GR.7S.3-GLE.2-EO.d.ii) How is finding the probability different and similar to finding the probability of a simple event? Why is it important in a compound even to determine if previous outcomes affect the sample space of an event? Authors of the Sample: Sarah Beesley (Aspen 1); Teresa Brown (Montrose County RE-1J); Terrell Price (Byers 32J) 7th Grade, Mathematics Complete Sample Curriculum – Posted: February 15, 2013 Page 11 of 14 Curriculum Development Overview Unit Planning for 7th Grade Mathematics Key Knowledge and Skills: My students will… What students will know and be able to do are so closely linked in the concept-based discipline of mathematics. Therefore, in the mathematics samples what students should know and do are combined. Understand probability of a chance event as a number between 0 and 1 that expresses the likelihood of the event occurring; larger numbers indicate greater likelihood (MA10-GR.7-S.3-GLE.2-EO.a) Recognize a probability near 0 indicates an unlikely event, a probability around 1/2 indicates an event that is neither unlikely nor likely, and a probability near 1 indicates a likely event (MA10-GR.7-S.3-GLE.2-EO.a) Approximate the probability of a chance event by collecting data on the chance process that produces it and observing its long-run relative frequency, and predict the approximate relative frequency given the probability. (MA10-GR.7-S.3-GLE.2-EO.b) Compare probabilities from a model to observed frequencies; if the agreement is not good, explain possible sources of the discrepancy (MA10-GR.7-S.3-GLE.2-EO.c.i) Develop a uniform probability model by assigning equal probability to all outcomes, and use the model to determine probabilities of events. (MA10-GR.7-S.3-GLE.2-EO.c.ii) Develop a probability model (which may not be uniform) by observing frequencies in data generated from a chance process. (MA10-GR.7-S.3-GLE.2-EO.c.iii) Understand that, just as with simple events, the probability of a compound event is the fraction of outcomes in the sample space for which the compound event occurs (MA10-GR.7-S.3-GLE.2-EO.d.i) Represent sample spaces for compound events using methods such as organized lists, tables and tree diagrams. (MA10-GR.7-S.3-GLE.2-EO.d.ii) Identify the outcomes in a sample space for an event described in everyday language. (MA10-GR.7-S.3-GLE.2-EO.d.iii) Design and use a simulation to generate frequencies for compound events. (MA10-GR.7-S.3-GLE.2-EO.d.iv) Critical Language: includes the Academic and Technical vocabulary, semantics, and discourse which are particular to and necessary for accessing a given discipline. EXAMPLE: A student in Language Arts can demonstrate the ability to apply and comprehend critical language through the following statement: “Mark Twain exposes the hypocrisy of slavery through the use of satire.” A student in ______________ can demonstrate the ability to apply and comprehend critical language through the following statement(s): It is important to generate a large number of trials when finding an experimental trial because then the experimental ratio better approximates theoretical ratio. I know that just because a sample space has two outcomes this does not mean it is modeled by a uniform model of probability, it is possible for one of the two outcomes to have a probability greater than 50%. Academic Vocabulary: Likely, unlikely, impossible, possible, chance, frequency, tables, organized lists, simulate, model, data, compare, represent, generate, Technical Vocabulary: Probability, likelihood, event, ratio, trials, frequency, outcomes, experimental probability, theoretical probability, simple events, compound events, sample spaces, fraction, tree diagrams, probability model, uniformed probability model, Authors of the Sample: Sarah Beesley (Aspen 1); Teresa Brown (Montrose County RE-1J); Terrell Price (Byers 32J) 7th Grade, Mathematics Complete Sample Curriculum – Posted: February 15, 2013 Page 12 of 14 Curriculum Development Overview Unit Planning for 7th Grade Mathematics Unit Title Data Daze Focusing Lens(es) Random Inference Inquiry Questions (EngagingDebatable): Unit Strands Statistics and Probability Concepts Representative, samples, statistics, generalizations, random, population, parameters, inferences, mean absolute deviations, multiplicative, ratio, additive, comparison, unit size, deviations, visual displays, measures of center, measures of variability, numerical data distributions, random sampling, representative samples, estimates, predictions Length of Unit Standards and Grade Level Expectations Addressed in this Unit 3 weeks MA10-GR.7-S.3-GLE.1 How can you declare a winner in an election before counting all the ballots? (MA10-GR.7-S.3-GLE.1-IQ.3) When playing music, does the shuffle function play songs randomly? How might the sample for a survey affect the results of the survey? (MA10-GR.7-S.3-GLE.1-IQ.1) Generalizations My students will Understand that… Guiding Questions Factual Conceptual Representative samples create statistics from which mathematicians make valid generalizations about a population. (MA10-GR.7-S.3-GLE.1-EO.a.i) What is a statistic? What is a sample? What is a population? What are examples of samples that would not be a valid representation of a population? Why do statistics based on a representative sample support generalizations about a population? Why do we investigate samples rather entire populations? Random and relatively large samples generate sample statistics that estimate population parameters and support valid inferences. (MA10-GR.7-S.3-GLE.1-EO.a.ii, a.iii, a.iv) How can you choose a representative sample of a population? How do you distinguish between random and bias samples? (MA10-GR.7-S.3-GLE.1-IQ.2) How do statistics from multiple samples generated from the same population compare to each other? Why is a random sample a method of generating a representative sample? Why do random samples better estimate or predict information about a population than non-random samples? Comparing mean absolute deviations requires a multiplicative (ratio) rather than additive comparison because mathematicians compare the unit size of the deviations to each other. (MA10-GR.7-S.3-GLE.1-EO.b.i) What is mean absolute deviation? How do you compare the mean absolute deviations of two data sets? Why are comparisons of mean absolute deviations stated as a ratio? Authors of the Sample: Sarah Beesley (Aspen 1); Teresa Brown (Montrose County RE-1J); Terrell Price (Byers 32J) 7th Grade, Mathematics Complete Sample Curriculum – Posted: February 15, 2013 Page 13 of 14 Curriculum Development Overview Unit Planning for 7th Grade Mathematics Visual displays, measures of center, and measures of variability for two numerical data distributions from random samples facilitate informal comparative inferences about two populations. (MA10-GR.7-S.3GLE.1-EO.b.i, b.ii) Key Knowledge and Skills: My students will… What are measures of center? What are measures of variability? Which visual displays help mathematicians informally assess the degree of overlap between two numerical data distributions? How do you determine what measure best represents the data? Why are both measures of center and variability important when comparing two numerical data distributions? What students will know and be able to do are so closely linked in the concept-based discipline of mathematics. Therefore, in the mathematics samples what students should know and do are combined. Understand statistics can be used to gain information about a population by examining a sample of the population; generalizations about a population from a sample are valid only if the sample is representative of that population (MA10-GR.7-S.3-GLE.1.a.i) Understand random sampling tends to produce representative samples and support valid inferences (MA10-GR.7-S.3-GLE.1-EO.a.ii) Use data from a random sample to draw inferences about a population with an unknown characteristic of interest. (MA10-GR.7-S.3-GLE.1-EO.a.i, a.ii) Generate multiple samples (or simulated samples) of the same size to gauge the variation in estimates or predictions. (MA10-GR.7-S.3-GLE.1-EO.a.iii, a.iv) Assess the degree of visual overlap Informally of two numerical data distributions with similar variables, measuring the difference between the centers by expressing it as a multiple of a measure of variability. (MA10-GR.7-S.3-GLE.1-EO.b.i) Use measures of center and measures of variability for numerical data from random samples to draw informal comparative inferences about two populations. (MA10-GR.7S.3-GLE.1-EO.b.ii) Critical Language: includes the Academic and Technical vocabulary, semantics, and discourse which are particular to and necessary for accessing a given discipline. EXAMPLE: A student in Language Arts can demonstrate the ability to apply and comprehend critical language through the following statement: “Mark Twain exposes the hypocrisy of slavery through the use of satire.” A student in ______________ can demonstrate the ability to apply and comprehend critical language through the following statement(s): When comparing two numerical data distributions, I begin by making a visual comparison using a box plot and then compare the means and mean absolute deviations. A random sample of the senior class will better predict the most popular location for prom than only surveying the calculus classes. Academic Vocabulary: Generate, informally, representative, generalizations, inferences, comparison, estimate, predict Technical Vocabulary: Stem and leaf plot, box plot, dot plot, sample, statistics, random, population, mean absolute deviations, multiplicative, ratio, additive, unit size, measures of center, mean, median, measures of variability, inter-quartile range, numerical data distributions, random sampling, representative samples, multiple samples, simulated samples, Authors of the Sample: Sarah Beesley (Aspen 1); Teresa Brown (Montrose County RE-1J); Terrell Price (Byers 32J) 7th Grade, Mathematics Complete Sample Curriculum – Posted: February 15, 2013 Page 14 of 14
