Statistics Homework Due Monday, September 19
advertisement
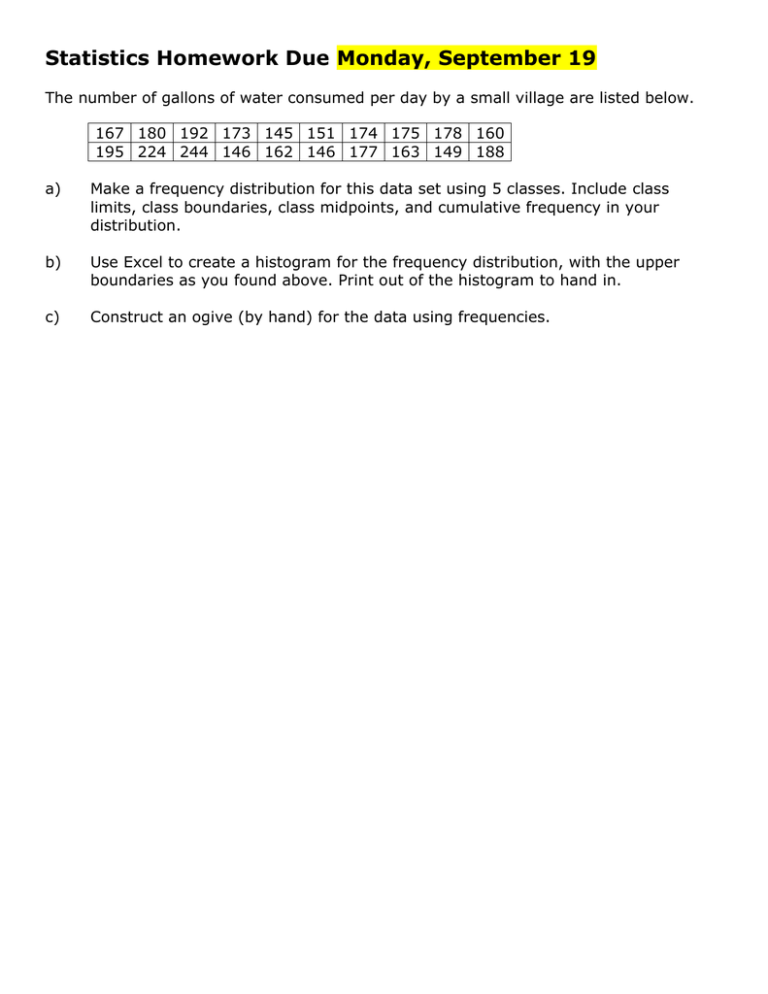
Statistics Homework Due Monday, September 19 The number of gallons of water consumed per day by a small village are listed below. 167 180 192 173 145 151 174 175 178 160 195 224 244 146 162 146 177 163 149 188 a) Make a frequency distribution for this data set using 5 classes. Include class limits, class boundaries, class midpoints, and cumulative frequency in your distribution. b) Use Excel to create a histogram for the frequency distribution, with the upper boundaries as you found above. Print out of the histogram to hand in. c) Construct an ogive (by hand) for the data using frequencies. Bin Frequency 164.5 8 184.5 7 204.5 3 224.5 1 244.5 1 Ogive using frequencies for Water Consumed per Day

