LOYOLA COLLEGE (AUTONOMOUS), CHENNAI – 600 034
advertisement
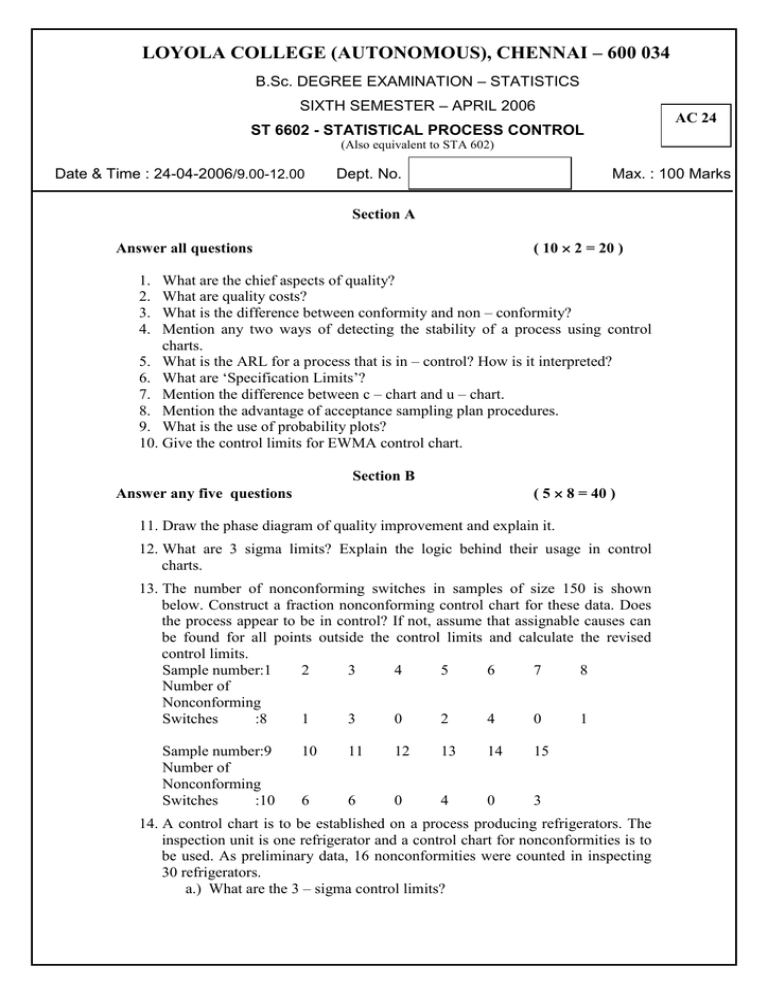
LOYOLA COLLEGE (AUTONOMOUS), CHENNAI – 600 034 B.Sc. DEGREE EXAMINATION – STATISTICS SIXTH SEMESTER – APRIL 2006 AC 24 ST 6602 - STATISTICAL PROCESS CONTROL (Also equivalent to STA 602) Date & Time : 24-04-2006/9.00-12.00 Dept. No. Max. : 100 Marks Section A ( 10 2 = 20 ) Answer all questions 1. 2. 3. 4. What are the chief aspects of quality? What are quality costs? What is the difference between conformity and non – conformity? Mention any two ways of detecting the stability of a process using control charts. 5. What is the ARL for a process that is in – control? How is it interpreted? 6. What are ‘Specification Limits’? 7. Mention the difference between c – chart and u – chart. 8. Mention the advantage of acceptance sampling plan procedures. 9. What is the use of probability plots? 10. Give the control limits for EWMA control chart. Section B ( 5 8 = 40 ) Answer any five questions 11. Draw the phase diagram of quality improvement and explain it. 12. What are 3 sigma limits? Explain the logic behind their usage in control charts. 13. The number of nonconforming switches in samples of size 150 is shown below. Construct a fraction nonconforming control chart for these data. Does the process appear to be in control? If not, assume that assignable causes can be found for all points outside the control limits and calculate the revised control limits. Sample number:1 2 3 4 5 6 7 8 Number of Nonconforming Switches :8 1 3 0 2 4 0 1 Sample number:9 Number of Nonconforming Switches :10 10 11 12 13 14 15 6 6 0 4 0 3 14. A control chart is to be established on a process producing refrigerators. The inspection unit is one refrigerator and a control chart for nonconformities is to be used. As preliminary data, 16 nonconformities were counted in inspecting 30 refrigerators. a.) What are the 3 – sigma control limits? b.) What is the probability of Type I error for this control chart? c.) What is the probability of Type II error for this control chart? d.) Find the average run length if the number of defects is actually 2. 15. Explain the different approaches in the construction of u – chart with variable sample size. 16. Explain the procedure for constructing a cumulative sum control chart. 17. What is meant by acceptance sampling? Mention its advantages. 18. Derive an expression for ‘Average Outgoing Quality’ with reference to single sampling plan. Section C Answer any two questions ( 2 20 = 40 ) 19. a.) Explain the role of designed experiments in quality improvement. b.) The data below represent the results of inspecting all units of a personal computer produced for the last 10 days. Construct a standardized fraction nonconforming control chart for these data. Does the process appear to be in control? If not, find the revised control limits. Day:1 2 3 4 5 6 7 8 9 10 Units Inspected:80 110 90 75 130 120 70 125 105 95 Nonconforming Units:4 7 5 8 6 6 4 5 8 7 (8+12) 20. a.) Explain the statistical basis of a p – chart and derive its control limits. b.) Construct probability plot to verify whether the following data has been generated from a normal population. 15,10,18,20,22,14,16,17. (10+10) 21. a.) Derive the control limits for X and R chart. b.) Bath concentrations are measured hourly in a chemical process. The following data shows the concentration observed on the past 10 days each on a 4 hourly period. Day Concentration 1 160 186 190 206 2 158 195 189 210 3 150 179 185 216 4 151 184 182 212 5 153 175 181 211 6 154 192 180 202 7 158 186 183 205 8 162 197 186 197 9 169 205 185 188 10 173 203 187 183 Analyze the data using the cumulative – sum control chart if the target mean concentration is 170. ( 10 + 10 ) 22. a) What are rectifying inspection plans? Mention its advantages. b)Consider a single sampling plan with n = 100 , c = 2. Find the OC function corresponding to the incoming lot fraction defective p = 0.05 , 0.10 , … , 0.30 ( 10 + 10 ) _______________ 98887711 Page No. 2
