LOYOLA COLLEGE (AUTONOMOUS), CHENNAI – 600 034
advertisement
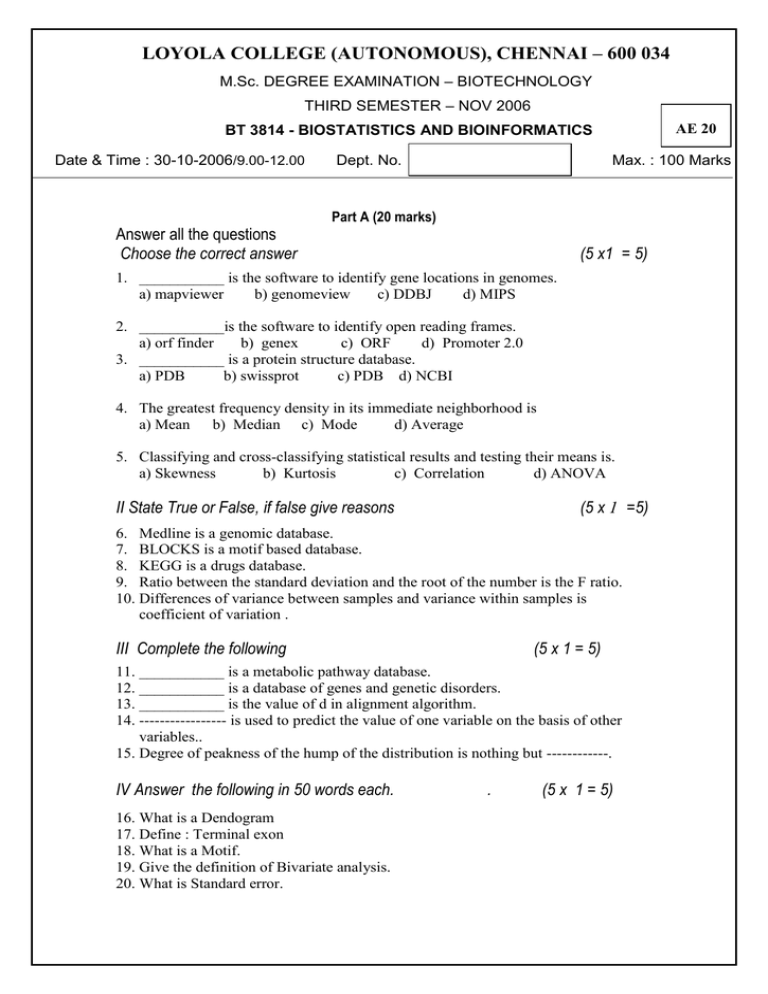
LOYOLA COLLEGE (AUTONOMOUS), CHENNAI – 600 034 M.Sc. DEGREE EXAMINATION – BIOTECHNOLOGY THIRD SEMESTER – NOV 2006 AE 20 BT 3814 - BIOSTATISTICS AND BIOINFORMATICS Date & Time : 30-10-2006/9.00-12.00 Answer all the questions Choose the correct answer Dept. No. Max. : 100 Marks Part A (20 marks) (5 x1 = 5) 1. ___________ is the software to identify gene locations in genomes. a) mapviewer b) genomeview c) DDBJ d) MIPS 2. ___________is the software to identify open reading frames. a) orf finder b) genex c) ORF d) Promoter 2.0 3. ___________ is a protein structure database. a) PDB b) swissprot c) PDB d) NCBI 4. The greatest frequency density in its immediate neighborhood is a) Mean b) Median c) Mode d) Average 5. Classifying and cross-classifying statistical results and testing their means is. a) Skewness b) Kurtosis c) Correlation d) ANOVA II State True or False, if false give reasons (5 x 1 =5) 6. Medline is a genomic database. 7. BLOCKS is a motif based database. 8. KEGG is a drugs database. 9. Ratio between the standard deviation and the root of the number is the F ratio. 10. Differences of variance between samples and variance within samples is coefficient of variation . III Complete the following (5 x 1 = 5) 11. ___________ is a metabolic pathway database. 12. ___________ is a database of genes and genetic disorders. 13. ___________ is the value of d in alignment algorithm. 14. ----------------- is used to predict the value of one variable on the basis of other variables.. 15. Degree of peakness of the hump of the distribution is nothing but ------------. IV Answer the following in 50 words each. 16. What is a Dendogram 17. Define : Terminal exon 18. What is a Motif. 19. Give the definition of Bivariate analysis. 20. What is Standard error. . (5 x 1 = 5) PART B Answer any Five of the following , each in about 350 words. (5 x 8 =40) Choose not more than THREE from each section. Section - A 21. Describe scoring matrices in detail. 22. Discuss Genscan and its applications. 23. Explain CpG islands, Codon usage analysis. 24. Discuss ORF finder in detail. Section – B 25. With suitable example, explain higher order table. 26. Obtain mean, median and mode for the following data. No. of wasps / colony 2 3 4 5 No. of colonies 4 6 8 12 6 7 7 7 27. Find the correlation coefficient between pesticides and food poisoning. Pesticides applied 17 13 15 16 06 11 14 09 07 (Kg) Intensity of food 36 46 35 24 12 18 27 22 02 poisoning 8 6 12 08 28. Briefly explain types of diagrams used to present statistical data. PART C Answer any Two of the following, each in about 1500 words. Draw diagrams / flowcharts wherever necessary. (2 x 20 = 40) 29.(a) Discuss the properties of lead compound and procedures in discovery of a drug. Or (b) Discuss the procedures and applications of Clustalw. 30. (a) The following table shows the ages (X) and systolic blood pressure (Y) of 8 persons. Age (X) 56 42 60 50 54 49 39 45 Blood pressure 160 130 125 135 145 115 140 120 (Y) Fit a linear regression equation of Y on X and estimate the blood pressure of a person of 70 years. Or (b) A certain manure was used on four plots of land A, B, C and D. Four beds were prepared in each plot and the manure used. The output of the crop in the beds of plots A, B, C and D is given below. A B C D 08 09 15 06 12 03 10 08 01 07 04 10 03 01 07 08
